Do men score lower on average compared to women on their statistics test? test scores of...
Do men score lower on average compared to women on their statistics test? test scores of nineteen randomly selected male statistics students and twenty-eight randomly selected female statistics students are shown below. Assume Equal Variances.
Male: 86, 83, 74, 76, 80, 63, 94, 91, 65, 95, 57, 91, 84, 85, 79, 76, 87, 94, 64
Excel
Female: 88, 99, 82, 90, 65, 99, 76, 93, 93, 69, 70, 89, 96, 83, 74, 77, 90, 91, 100, 78, 76, 100, 78, 84, 100, 72, 100, 103
Excel
Assume both follow a Normal distribution. What can be concluded at the = 0.05 level of the significance?
For this study, we should use Select an answer t-test for the difference between two dependent population means t-test for the difference between two independent population means t-test for a population mean z-test for the difference between two population proportions z-test for a population proportion
- The null and alternative hypotheses would be:
H0:H0: Select an answer μ1 p1 Select an answer ≠ = ≤ ≥ Select an answer p2 μ2 (please enter a decimal)
H1:H1: Select an answer p1 μ1 Select an answer < > ≠ = Select an answer μ2 p2 (Please enter a decimal)
- The test statistic ? t z
- The test statistic = (please show your answer to 3 decimal places.)
- The p-value = (Please show your answer to 4 decimal places.)
- The p-value is ? ≤ > αα
- Based on this, we should Select an answer accept fail to reject reject the null hypothesis.
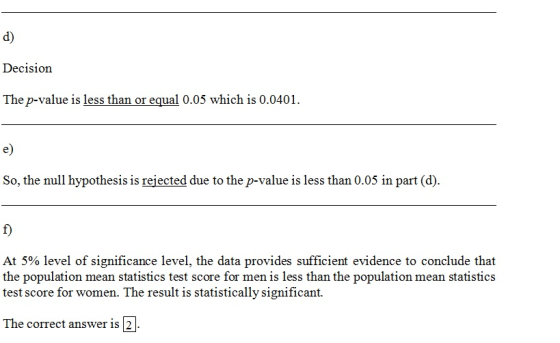
- Thus, the conclusion is that ... Select an answer At the 5% significance level, the data provides insufficient evidence to conclude that the population mean statistics test score for men is less than the population mean statistics test score for women. At the 5% significance level, the data provides sufficient evidence to conclude that the population mean statistics test score for men is less than the population mean statistics test score for women.
Homework Answers


Add Answer to:
Do men score lower on average compared to women on their
statistics test? test scores of...
Do men take less time than women to get out of bed in the morning? The...
Do men take less time than women to get out of bed in the morning? The 60 men observed averaged 6.8 minutes to get out of bed after the alarm rang. Their standard deviation was 5.8. The 44 women observed averaged 2 minutes and their standard deviation was 2.6 minutes. What can be concluded at the αα = 0.10 level of significance? Assuming Unequal Variances For this study, we should use Select an answer z-test for the difference between two...
Do men score lower on average compared to women on their statistics finals? Final exam scores...
 Do men score lower on average compared to women on their statistics finals? Final exam scores of twelve randomly selected male statistics students and twelve randomly selected female statistics students are shown below. Male: 74 62 81 68 82 77 85 61 67 87 66 83 Female: 959973 78 92 84 82 78 81 90 78 67 Assume both follow a Normal distribution. What can be concluded at the the a=0.01 level of significance level of significance? For this study,...
Given in the table are the BMI statistics for random samples of men and women. Assume...
Given in the table are the BMI statistics for random samples of men and women. Assume that the two samples are independent simple random samples selected from normally distributed populations, and do not assume that the population standard deviations are equal. Complete parts (a) and (b) below. Use a 0.01 significance level for both parts. Male BMI Female BMI μ μ1 μ2 n 45 45 x 27.3958 24.7599 s 7.837628 4.750044 a. Test the claim that males and females have...
Do students perform worse when they take a test alone than when they take an test...
Do students perform worse when they take a test alone than when they take an test in a classroom setting? Eight students were given two tests of equal difficulty. They took one test in a solitary room and they took the other in a room filled with other students. The results are shown below. test Scores Alone 70 79 74 80 76 86 67 85 Classroom 74 79 90 82 81 97 70 84 Copy to Clipboard Assume a Normal...
The federal government would like to test the hypothesis that the average age of men filing...
The federal government would like to test the hypothesis that the average age of men filing for Social Security is higher than the average age of women set using α = 0.05 with the following data: Men Women Sample mean 64.5 years 63.6 years Sample size 35 39 Population standard deviation 3.0 years 3.5 years If Population 1 is defined as men and Population 2 is defined as women, the correct hypothesis statement for this hypothesis test would be H0: μ1...
Do shoppers at the mall spend less money on average the day after Thanksgiving compared to...
Do shoppers at the mall spend less money on average the day after Thanksgiving compared to the day after Christmas? The 57 randomly surveyed shoppers on the day after Thanksgiving spent an average of $143. Their standard deviation was $30. The 53 randomly surveyed shoppers on the day after Christmas spent an average of $138. Their standard deviation was $36. What can be concluded at the αα = 0.10 level of significance? Assuming Equal Variances For this study, we should...
The average score for the statistics course is 39%. A professor wants to see if the...
The average score for the statistics course is 39%. A professor wants to see if the average score for students who are given colored pens on the first day of class is larger. The scores for the 16 randomly selected students who were given the colored pens are shown below. Assume that the distribution of the population is normal. 44, 34, 32, 48, 42, 33, 40, 41, 50, 36, 50, 51, 43, 48, 47, 45 Copy to clipboard What can...
Do political science classes require the same amount of writing as history classes? The 41 random...
Do political science classes require the same amount of writing as history classes? The 41 randomly selected political science classes assigned an average of 15.8 pages of essay writing for the course. The standard deviation for these 41 classes was 3.4 pages. The 46 randomly selected history classes assigned an average of 16.5 pages of essay writing for the course. The standard deviation for these 46 classes was 4.8 pages. What can be concluded at the αα = 0.05 level...
Use the given statistics to complete parts (a) and (b). Assume that the populations are normally...
Use the given statistics to complete parts (a) and (b). Assume that the populations are normally distributed. Population 1 Population 2 n 26 16 x 49.8 40.1 s 6.8 13.2 (a) Test whether μ1 > μ2 at the α = 0.01 level of significance for the given sample data. (b) Construct a 90% confidence interval about μ1 − μ2 . (a) Identify the null and alternative hypotheses for this test. A. H0 : μ1 ≠...
Use the given statistics to complete parts (a) and (b). Assume that the populations are normally...
Use the given statistics to complete parts (a) and (b). Assume that the populations are normally distributed. (a) Test whether mu 1 μ1 greater than > mu 2 μ2 at the α = 0.01 level of significance for the given sample data. (b) Construct a 90% confidence interval about μ1 − μ2. (a) Identify the null and alternative hypotheses for this test. A. H0: μ1=μ2 H1: μ1≠ μ2 B. H0: μ1=μ2 H1: μ1<μ2 C. H0: μ1=μ2 H1: μ1>μ2 Your...
 Do men score lower on average compared to women on their statistics finals? Final exam scores of twelve randomly selected male statistics students and twelve randomly selected female statistics students are shown below. Male: 74 62 81 68 82 77 85 61 67 87 66 83 Female: 959973 78 92 84 82 78 81 90 78 67 Assume both follow a Normal distribution. What can be concluded at the the a=0.01 level of significance level of significance? For this study,...
Most questions answered within 3 hours.
-
For the following reaction, 0.128 moles of
potassium hydrogen sulfateare mixed with
0.504 moles of potassium...
asked 2 hours ago -
1. What is the present value of $400, three years in the future
if the interest...
asked 3 hours ago -
The labor force minus the number of employed equals the number
of unemployed.
a. True
b....
asked 5 hours ago -
Determine the mass in units of grams [g] of 0.49 moles [mol]
of a new fictitious...
asked 5 hours ago -
A horizontal mass of M=5kg is on a spring and stretched to
x=0.5m when released from...
asked 7 hours ago -
26 of 50
"I have worked at the Arizona Humane Society for ten years, and
have...
asked 7 hours ago -
Compare and contrast zero based budgeting and incremental (or
base year) budgeting.
asked 7 hours ago -
4 pts 10. Which of the following hypothesis would be MOST
difficult to test experimentally? Group...
asked 7 hours ago -
A business owner makes 1,000 items a day. Each day he or she
contributes eight hours...
asked 7 hours ago -
A
circular loop in the plane of a paper lies inca0.65 T magnetic
field pointing into...
asked 7 hours ago -
A business owner is trying to decide whether to buy, rent, or
lease office space and...
asked 7 hours ago -
Thermal Storage Solar heating of a house is much more efficient
if there is a way...
asked 8 hours ago