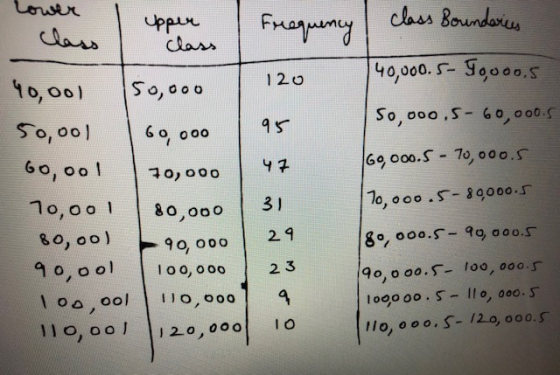
Calculate the parameters of the probability distribution below. Interpret the results of your chosen scenario (salary ranges for jobs in Minnesota).
a) Mean
b) Variance
c) Standard Deviation
Homework Answers
The table is shown as -
| Class Boundaries | Class Mark (x) | Frequency (f) |
| 40000.5-50000.5 | 45000.5 | 120 |
| 50000.5-60000.5 | 55000.5 | 95 |
| 60000.5-70000.5 | 65000.5 | 47 |
| 70000.5-80000.5 | 75000.5 | 31 |
| 80000.5-90000.5 | 85000.5 | 29 |
| 90000.5-100000.5 | 95000.5 | 23 |
| 100000.5-110000.5 | 105000.5 | 9 |
| 110000.5-120000.5 | 115000.5 | 10 |
| Total | 364 |
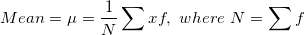
![\small =\frac{1}{364}[(45000.5\times 120)+...+(115000.5\times 10)]=62500.5](http://img.homeworklib.com/questions/71290d70-0e70-11eb-ba2a-07199a1b91e0.png?x-oss-process=image/resize,w_560)

= 357211538
 (Answer)
Add Answer to:
Calculate the parameters of the probability distribution below.
Interpret the results of your chosen scenario (salary...
find the mean,variance, standard deviation of the propability distribution and interpret the results 32. Extracurricular Activities...
 find the mean,variance, standard deviation of the
propability distribution and interpret the results
32. Extracurricular Activities The number of school-related extracurricular activities per student 6 Activities 3 4 0,053 0.084 Probability 0.213 0.059 0.122 0.163 0178 0.128
find the mean,variance, standard deviation of the
propability distribution and interpret the results
32. Extracurricular Activities The number of school-related extracurricular activities per student 6 Activities 3 4 0,053 0.084 Probability 0.213 0.059 0.122 0.163 0178 0.128
Use the probability distribution to complete parts (a) and (b) below. The number of school-related extracurricular...
 Use the probability distribution to complete parts (a) and (b) below. The number of school-related extracurricular activities per student Activities 1 2 3 0.061 0.123 0.161 0.176 0.213 0.128 0.084 0.054 Probability (a) Find the mean, variance, and standard deviation of the probability distribution. The mean is (Round to one decimal place as needed.) The variance is (Round to one decimal place as needed.) The standard deviation is. (Round to one decimal place as needed.) (b) Interpret the results. ,...
Use the probability distribution to complete parts (a) and (b) below. The number of defects per...
 Use the probability distribution to complete parts (a) and (b) below. The number of defects per 1000 machine parts inspected Defects 0 3 Probability 0.268 0.305 0.240 0.140 2 O 4 0.036 5 0.011 (a) Find the mean, variance, and standard deviation of the probability distribution. The mean is (Round to one decimal place as needed.) The variance is (Round to one decimal place as needed.) The standard deviation is (Round to one decimal place as needed.) (b) Interpret the...
Use the probability distribution to complete parts (a) and (b) below. The number of defects per 1...
 Use the probability distribution to complete parts (a) and (b) below. The number of defects per 1000 machine parts inspected Defects Probability 0.266 0.299 0.237 0.1440.036 4 0.018 (a) Find the mean, variance, and standard deviation of the probability distribution. The mean is Round to one decimal place as needed.) The variance is (Round to one decimal place as needed.) The standard deviation is (Round to one decimal place as needed.) (b) Interpret the results. The mean isso the average...
how do i do this ? 4. Find the mean and the standard deviation of the...
 how do i do this ?
4. Find the mean and the standard deviation of the following frequency distribution table: Class Limits 24-29 30-35 36-41 42-47 Class Boundaries 23.5-29.5 29.5-35.5 35.5-41.5 41.5-47.5 Class Midpoint 26.5 32.5 38.5 44.5 Class Frequency 4 9 15 2 Cumulative F. 4 13 28 30 Mean: Standard Deviation: 5. Nurses monthly salaries have a bell shaped distribution with x = $6400 with S = $300. a. Find the 68% and 95% range b. Abby made...
how do i do this ?
4. Find the mean and the standard deviation of the following frequency distribution table: Class Limits 24-29 30-35 36-41 42-47 Class Boundaries 23.5-29.5 29.5-35.5 35.5-41.5 41.5-47.5 Class Midpoint 26.5 32.5 38.5 44.5 Class Frequency 4 9 15 2 Cumulative F. 4 13 28 30 Mean: Standard Deviation: 5. Nurses monthly salaries have a bell shaped distribution with x = $6400 with S = $300. a. Find the 68% and 95% range b. Abby made...
Calculate the mean, the variance, and the standard deviation of the following discrete probability distribution
 Calculate the mean, the variance, and the standard deviation of the following discrete probability distribution. (Negative values should be indicated by a minus sign. Round intermediate calculations to at least 4 decimal places. Round your final answers to 2 decimal places.)$$ \begin{array}{lrrrr} x & -23 & -17 & -9 & -3 \\ P(x=x) & 0.50 & 0.25 & 0.15 & 0.10 \end{array} $$Mean:Variance:Standard Deviation:
The frequency distribution shows the results of 200 test scores. Are the test scores normally distributed?...
 The frequency distribution shows the results of 200 test scores. Are the test scores normally distributed? Use a =0.01. Complete parts (a) through (e). Class boundaries 49.5-58.5 58.5-67.5 Frequency, f 19 62 D 67.5-76.5 81 76.5-85.5 33 85.5-94.5 5 Using a chi-square goodness-of-fit test, you can decide, with some degree of certainty, whether a variable is normally distributed. In all chi-square tests for normality, the null and alternative hypotheses are as follows. Ho: The test scores have a normal distribution....
Engineering Statistics. Lab # 2 (chapter 3 Material) Using Minitab to Plot Frequency distribution and calculate Mea...
 Engineering Statistics. Lab # 2 (chapter 3 Material) Using Minitab to Plot Frequency distribution and calculate Mean, Variance, and Standard Deviation of a general discrete random variable As we discussed in early part of chapter 3 material (Random Variables and Probability distributions), Minitab cannot help you solve general discrete probability problems we have discussed so far, It could be used to graph probability mass distribution and determine mean, Variance, ...of general random variable X when P(x) is given. Suppose you...
As we've previously seen, equations describing situations often contain uncertain parameters, that is, parameters that aren't...
 As we've previously seen, equations describing situations often contain uncertain parameters, that is, parameters that aren't necessarily a single value but instead are associated with a probability distribution function. When more than one of the variables is unknown, the outcome is difficult to visualize. A common way to overcome this difficulty is to simulate the scenario many times and count the number of times different ranges of outcomes occur. One such popular simulation is called a Monte Carlo Simulation. In...
As we've previously seen, equations describing situations often contain uncertain parameters, that is, parameters that aren't...
 As we've previously seen, equations describing situations often contain uncertain parameters, that is, parameters that aren't necessarily a single value but instead are associated with a probability distribution function. When more than one of the variables is unknown, the outcome is difficult to visualize. A common way to overcome this difficulty is to simulate the scenario many times and count the number of times different ranges of outcomes occur. popular simulation is called a Monte Carlo Simulation. In this problem-solving...
 find the mean,variance, standard deviation of the
propability distribution and interpret the results
32. Extracurricular Activities The number of school-related extracurricular activities per student 6 Activities 3 4 0,053 0.084 Probability 0.213 0.059 0.122 0.163 0178 0.128
find the mean,variance, standard deviation of the
propability distribution and interpret the results
32. Extracurricular Activities The number of school-related extracurricular activities per student 6 Activities 3 4 0,053 0.084 Probability 0.213 0.059 0.122 0.163 0178 0.128
 Use the probability distribution to complete parts (a) and (b) below. The number of school-related extracurricular activities per student Activities 1 2 3 0.061 0.123 0.161 0.176 0.213 0.128 0.084 0.054 Probability (a) Find the mean, variance, and standard deviation of the probability distribution. The mean is (Round to one decimal place as needed.) The variance is (Round to one decimal place as needed.) The standard deviation is. (Round to one decimal place as needed.) (b) Interpret the results. ,...
 Use the probability distribution to complete parts (a) and (b) below. The number of defects per 1000 machine parts inspected Defects 0 3 Probability 0.268 0.305 0.240 0.140 2 O 4 0.036 5 0.011 (a) Find the mean, variance, and standard deviation of the probability distribution. The mean is (Round to one decimal place as needed.) The variance is (Round to one decimal place as needed.) The standard deviation is (Round to one decimal place as needed.) (b) Interpret the...
 Use the probability distribution to complete parts (a) and (b) below. The number of defects per 1000 machine parts inspected Defects Probability 0.266 0.299 0.237 0.1440.036 4 0.018 (a) Find the mean, variance, and standard deviation of the probability distribution. The mean is Round to one decimal place as needed.) The variance is (Round to one decimal place as needed.) The standard deviation is (Round to one decimal place as needed.) (b) Interpret the results. The mean isso the average...
 how do i do this ?
4. Find the mean and the standard deviation of the following frequency distribution table: Class Limits 24-29 30-35 36-41 42-47 Class Boundaries 23.5-29.5 29.5-35.5 35.5-41.5 41.5-47.5 Class Midpoint 26.5 32.5 38.5 44.5 Class Frequency 4 9 15 2 Cumulative F. 4 13 28 30 Mean: Standard Deviation: 5. Nurses monthly salaries have a bell shaped distribution with x = $6400 with S = $300. a. Find the 68% and 95% range b. Abby made...
how do i do this ?
4. Find the mean and the standard deviation of the following frequency distribution table: Class Limits 24-29 30-35 36-41 42-47 Class Boundaries 23.5-29.5 29.5-35.5 35.5-41.5 41.5-47.5 Class Midpoint 26.5 32.5 38.5 44.5 Class Frequency 4 9 15 2 Cumulative F. 4 13 28 30 Mean: Standard Deviation: 5. Nurses monthly salaries have a bell shaped distribution with x = $6400 with S = $300. a. Find the 68% and 95% range b. Abby made...
 Calculate the mean, the variance, and the standard deviation of the following discrete probability distribution. (Negative values should be indicated by a minus sign. Round intermediate calculations to at least 4 decimal places. Round your final answers to 2 decimal places.)$$ \begin{array}{lrrrr} x & -23 & -17 & -9 & -3 \\ P(x=x) & 0.50 & 0.25 & 0.15 & 0.10 \end{array} $$Mean:Variance:Standard Deviation:
 The frequency distribution shows the results of 200 test scores. Are the test scores normally distributed? Use a =0.01. Complete parts (a) through (e). Class boundaries 49.5-58.5 58.5-67.5 Frequency, f 19 62 D 67.5-76.5 81 76.5-85.5 33 85.5-94.5 5 Using a chi-square goodness-of-fit test, you can decide, with some degree of certainty, whether a variable is normally distributed. In all chi-square tests for normality, the null and alternative hypotheses are as follows. Ho: The test scores have a normal distribution....
 Engineering Statistics. Lab # 2 (chapter 3 Material) Using Minitab to Plot Frequency distribution and calculate Mean, Variance, and Standard Deviation of a general discrete random variable As we discussed in early part of chapter 3 material (Random Variables and Probability distributions), Minitab cannot help you solve general discrete probability problems we have discussed so far, It could be used to graph probability mass distribution and determine mean, Variance, ...of general random variable X when P(x) is given. Suppose you...
 As we've previously seen, equations describing situations often contain uncertain parameters, that is, parameters that aren't necessarily a single value but instead are associated with a probability distribution function. When more than one of the variables is unknown, the outcome is difficult to visualize. A common way to overcome this difficulty is to simulate the scenario many times and count the number of times different ranges of outcomes occur. One such popular simulation is called a Monte Carlo Simulation. In...
 As we've previously seen, equations describing situations often contain uncertain parameters, that is, parameters that aren't necessarily a single value but instead are associated with a probability distribution function. When more than one of the variables is unknown, the outcome is difficult to visualize. A common way to overcome this difficulty is to simulate the scenario many times and count the number of times different ranges of outcomes occur. popular simulation is called a Monte Carlo Simulation. In this problem-solving...
Most questions answered within 3 hours.
-
the following reaction occurs in a balloon containing
N2O2 gas
N2O4(g)=2NO2(g)
will the volume of the...
asked 23 minutes ago -
answer the questions throughout this program
public class Day implements Comparable {
Private Boolean atWork;...
asked 30 minutes ago -
This is C++ code for parking fee management program
#include <iostream>
#include <iomanip>
using namespace std;...
asked 41 minutes ago -
The free energy change for the following reaction at 25 °C, when
[Sn2+] = 1.17 M...
asked 2 hours ago -
An MNE is this kind of industry when competition in one country
is essentially independent of...
asked 3 hours ago -
. For this set of questions, determine what
proportion of a normal distribution is located betweeneach...
asked 4 hours ago -
A college student is employed as a door-to-door newspaper
salesman. Historical data suggests that the student...
asked 5 hours ago -
MATLAB HW 11 problem using Switch Case and Input commands
Write a script file that calculates...
asked 5 hours ago -
Considering gravitational time dilation, calculate the time that
passes in Earth’s surface while 1 hour passes...
asked 5 hours ago -
Minitab Problem: Take the Lake Hume June rainfall data and find
use the processes outlined in...
asked 6 hours ago -
X Company is trying to decide whether to continue using old
equipment to make Product A...
asked 6 hours ago -
IN PYTHON ONLY !! Program 2: Re-work
program #5 (WeeklyHours) from the previous assignment such that...
asked 7 hours ago