
Homework Answers
41.
a. The sampling distribution of p-bar is normal since np = 800*0.17 = 136 > 10 and n(1-p) = 800*0.83 = 664 > 10.
The sampling distribution of p-bar has been represented below:

The sampling distribution of p-bar is done using STATKEY. We select Sampling Distribution for proportion then enter the proportion value as 0.17 and enter sample size as 800. Then we generate 1000 samples.


Add Answer to:
31. The Food Marketing Institute shows that 17% of households spend more than 105 weck on...
The Food Marketing Institute shows that of households spend more than per week on groceries. Assume the population...
 The Food Marketing Institute shows that of households
spend more than per week on groceries. Assume the
population proportion is and a simple random sample of
households will be selected from the population. Use
z-table.
a. Calculate the sampling distribution of , the
proportion of households spending more than per week on
groceries.
(to 2 decimals)
(to 4 decimals)
b. What is the probability that the sample
proportion will be within of the population proportion
(to 4 decimals)?
eBook The Food Marketing Institute shows that...
The Food Marketing Institute shows that of households
spend more than per week on groceries. Assume the
population proportion is and a simple random sample of
households will be selected from the population. Use
z-table.
a. Calculate the sampling distribution of , the
proportion of households spending more than per week on
groceries.
(to 2 decimals)
(to 4 decimals)
b. What is the probability that the sample
proportion will be within of the population proportion
(to 4 decimals)?
eBook The Food Marketing Institute shows that...
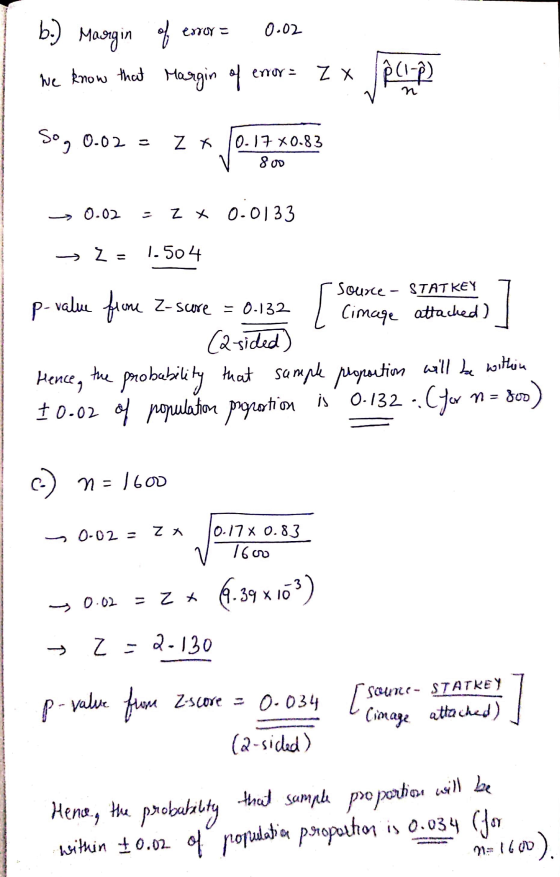
The Food Marketing Institute shows that 17% of households spend more than $100 per week on...
The Food Marketing Institute shows that 17% of households spend more than $100 per week on groceries. Assume the population proportion is p = 0.17 and a sample of 700 households will be selected from the population. (a) Show the sampling distribution of p, the sample proportion of households spending more than $100 per week on groceries. (b) What is the probability that the sample proportion will be within ±0.02 of the population proportion? (c) Answer part (b) for a sample of...
The Food Marketing Institute shows that 17% of households spend more than $100 per week on groceries
The Food Marketing Institute shows that 17% of households spend more than $100 per week on groceries. Assume the population proportion is p = 0.17 and a sample of 900 households will be selected from the population. Use z-table. a. Calculate σ(p̅), the standard error of the proportion of households spending more than $100 per week on groceries to 4 decimals b. What is the probability that the sample proportion will be within +/- 0.02 of the population proportion (to 4 decimals)? c....
The Food Marketing Institute shows that 15% of households spend more than $100 per week on groceries
The Food Marketing Institute shows that 15% of households spend more than $100 per week on groceries. Assume the population proportion is p = 0.15 and a sample of 800 households will be selected from the population. Use z-table.Calculate ( ), the standard error of the proportion of households spending more than $100 per week on groceries (to 4 decimals).What is the probability that the sample proportion will be within +/- 0.02 of the population proportion (to 4 decimals)?What is...
A Food Marketing Institute found that 32% of households spend more than $125 a week on...
A Food Marketing Institute found that 32% of households spend more than $125 a week on groceries. Assume the population proportion is 0.32 and a simple random sample of 111 households is selected from the population. What is the probability that the sample proportion of households spending more than $125 a week is between 0.27 and 0.38?
The Food Marketing Institute shows that 16% of households spend more than $100 per week on...
The Food Marketing Institute shows that 16% of households spend more than $100 per week on groceries. Assume the population proportion is p = 0.16 and a sample of 900 households will be selected from the population. Use z-table. Calculate (), the standard error of the proportion of households spending more than $100 per week on groceries (to 4 decimals). What is the probability that the sample proportion will be within +/- 0.03 of the population proportion (to 4 decimals)?...
The Food Marketing Institute shows that 16% of households spend more than $100 per week on...
The Food Marketing Institute shows that 16% of households spend more than $100 per week on groceries. Assume the population proportion is p = 0.16 and a sample of 600 households will be selected from the population. Use z-table. Calculate ( ), the standard error of the proportion of households spending more than $100 per week on groceries (to 4 decimals). What is the probability that the sample proportion will be within +/- 0.02 of the population proportion (to 4...
A Food Marketing Institute found that 53% of households spend more than $125 a week on...
A Food Marketing Institute found that 53% of households spend more than $125 a week on groceries. Assume the population proportion is 0.53 and a simple random sample of 105 households is selected from the population. What is the probability that the sample proportion of households spending more than $125 a week is more than than 0.34? Note: You should carefully round any z-values you calculate to 4 decimal places to match wamap's approach and calculations. Answer =
1/A Food Marketing Institute found that 27% of households spend more than $125 a week on...
1/A Food Marketing Institute found that 27% of households spend more than $125 a week on groceries. Assume the population proportion is 0.27 and a simple random sample of 132 households is selected from the population. What is the probability that the sample proportion of households spending more than $125 a week is less than 0.3? Note: You should carefully round any z-values you calculate to 4 decimal places to match wamap's approach and calculations. Answer = 2/ A Food...
A Food Marketing Institute found that 26% of households spend more than $125 a week on...
A Food Marketing Institute found that 26% of households spend more than $125 a week on groceries. Assume the population proportion is 0.26 and a simple random sample of 324 households is selected from the population. What is the probability that the sample proportion of households spending more than $125 a week is less than 0.27? Answer = (Enter your answer as a number accurate to 4 decimal places.)
 The Food Marketing Institute shows that of households
spend more than per week on groceries. Assume the
population proportion is and a simple random sample of
households will be selected from the population. Use
z-table.
a. Calculate the sampling distribution of , the
proportion of households spending more than per week on
groceries.
(to 2 decimals)
(to 4 decimals)
b. What is the probability that the sample
proportion will be within of the population proportion
(to 4 decimals)?
eBook The Food Marketing Institute shows that...
The Food Marketing Institute shows that of households
spend more than per week on groceries. Assume the
population proportion is and a simple random sample of
households will be selected from the population. Use
z-table.
a. Calculate the sampling distribution of , the
proportion of households spending more than per week on
groceries.
(to 2 decimals)
(to 4 decimals)
b. What is the probability that the sample
proportion will be within of the population proportion
(to 4 decimals)?
eBook The Food Marketing Institute shows that...
Most questions answered within 3 hours.
-
Describe how to measure benefits, including specific examples of
clinical and financial benefits that can be...
asked 9 minutes ago -
Costs associated with the manufacture of miniature
high-sensitivity piezoresistive pressure transducers is $74,000 per
year. A...
asked 24 minutes ago -
Given the following information for Jane Cole complete schedule
D of 1040 through part III and...
asked 24 minutes ago -
Why doesn't a small piece of uranium go naturally into a chain
reaction?
A) A small...
asked 28 minutes ago -
Last year’s freshman class at Big State University totaled 5,324
students. Of those, 1,254 received a...
asked 37 minutes ago -
The transverse displacement of a stretched string from
equilibrium as a function of time and position...
asked 40 minutes ago -
Do a detailed SWOT analysis for a small Agribusiness company in
Brazil
asked 40 minutes ago -
Which two measures of excellence are often in
conflict/contradiction with each other (and therefore difficult to...
asked 39 minutes ago -
Which of the following factors does not
negatively impact operating cash flows?
Group of answer choices...
asked 42 minutes ago -
How
is the relative placement handled with the Interstate Compact
Placement of children?
asked 44 minutes ago -
Overall, the Miles Per Gallon for customers of MallState is
normally distributed around 34 MPG with...
asked 57 minutes ago -
Under Armour, a multinational sports apparel company plans entry
into a new geographical location, Vietnam, considered...
asked 58 minutes ago