
Homework Answers


Add Answer to:
The accompanying data was obtained in an experiment to investigate whether compressive strength of concrete cylinders...
The accompanying data was obtained in an experiment to investigate whether compressive strength of concrete cylinders...
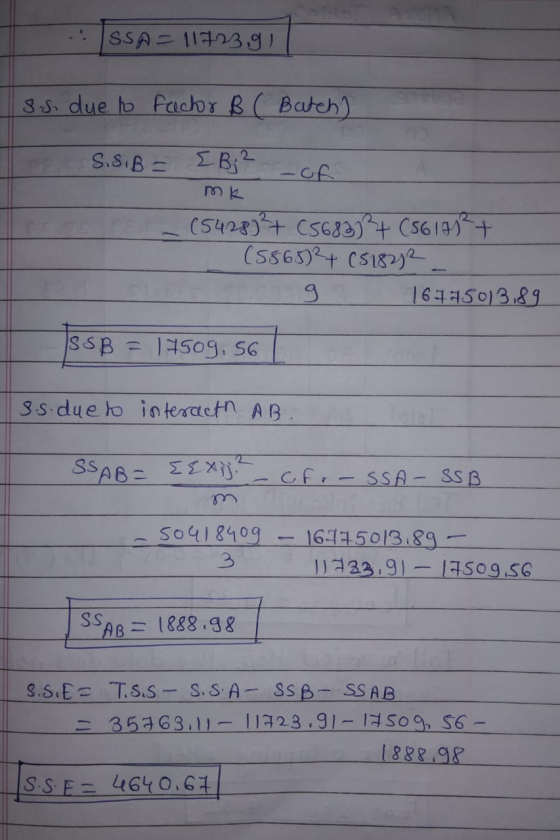
 The accompanying data was obtained in an experiment to investigate whether compressive strength of concrete cylinders depends on the type of capping material used (factor A) or variability in different batches (factor 8). Each number is a cell total (x,y) based on K = 3 observations. 1 1 1846 1778 1804 2 1941 1850 Batch 3 1935 1792 1890 4 1889 1785 1892 5 1799 1626 1757 Capping Material 2 3 1892 In addition, EDX 2 = 16,810,777 and 2x...
An experiment was carried out to investigate the effect of species (factor A, with I =...
 An experiment was carried out to investigate the effect of species (factor A, with I = 4) and grade (factor B, with ) = 3) on breaking strength of wood specimens. One observation was made for each species-grade combination-resulting in SSA = 444.0, SSB = 423.6, and SSE = 127.4. Assume that an additive model is appropriate. (a) Test Ho: a = a 2 = az = Q 4 = 0 (no differences in true average strength due to species)...
An experiment was carried out to investigate the effect of species (factor A, with I =...
An experiment was carried out to investigate the effect of species (factor A, with I = 4) and grade (factor B, with J = 3) on breaking strength of wood specimens. One observation was made for each species—grade combination—resulting in SSA = 445.0, SSB = 429.6, and SSE = 124.4. Assume that an additive model is appropriate. (a) Test H0: α1 = α2 = α3 = α4 = 0 (no differences in true average strength due to species) versus Ha:...
An experiment was carried out to investigate the effect of species (factor A, with I =...
 An experiment was carried out to investigate the effect of species (factor A, with I = 4) and grade (factor B, with ) = 3) on breaking strength of wood specimens. One observation was made for each species-grade combination-resulting in SSA = 443.0, SSB = 428.6, and SSE = 122.4. Assume that an additive model is appropriate. (a) Test Ho: a1 = a2 = 03 = 24 = 0 (no differences in true average strength due to species) versus Ha:...
ANSWER IS EITHER A OR B ANSWER IS EITHER B OR D Consider the accompanying data...
 ANSWER IS EITHER A OR B
ANSWER IS EITHER B OR D
Consider the accompanying data on breaking load (kg/25 mm width) for various fabrics in both an unabraded condition and an abraded condition. Use the paired t test to test Ho: HD0 sus H: HD > 0 at significance level 0.01. (Use Fabric 1 36.3 28.5 2 55.0 20.0 3 51.1 46.0 4 38.7 34.0 5 43.2 36.0 6 48.8 52.5 7 25.6 26.5 8 49.5 46.5 Calculate the...
ANSWER IS EITHER A OR B
ANSWER IS EITHER B OR D
Consider the accompanying data on breaking load (kg/25 mm width) for various fabrics in both an unabraded condition and an abraded condition. Use the paired t test to test Ho: HD0 sus H: HD > 0 at significance level 0.01. (Use Fabric 1 36.3 28.5 2 55.0 20.0 3 51.1 46.0 4 38.7 34.0 5 43.2 36.0 6 48.8 52.5 7 25.6 26.5 8 49.5 46.5 Calculate the...
strength of polymer latex modified mortar (Portland cement mortar to which polymer latex emulsions have been...
 strength of polymer latex modified mortar (Portland cement mortar to which polymer latex emulsions have been added during miing) to that o unmodified mortar resulted in x 18.16 kgt/cm2 for the modified mortar (m 42) and y tension bond strengths for the modified and unmodified -16.87 kgf/cm2 for the unm dined mortar (n = 30). Let μ1 and», be the true average mortars, respectively. Assume that the bond strength distributions are both normal. (a) Assuming that σ1 1.6 and σ2-1.3,...
Consider the accompanying data on breaking load (kg/25 mm width) for various fabrics in both an...
Consider the accompanying data on breaking load (kg/25 mm width) for various fabrics in both an unabraded condition and an abraded condition. Use the paired t test to test H0: ?D = 0 versus Ha: ?D > 0 at significance level 0.01. (Use ?D = ?U ? ?A.) Fabric 1 2 3 4 5 6 7 8 U 36.2 55.0 51.4 38.7 43.2 48.8 25.6 49.5 A 28.5 20.0...
Four different coatings are being considered for corrosion protection of metal pipe. The pipe will be...
 Four different coatings are being considered for corrosion protection of metal pipe. The pipe will be buried in three different types of soil. To investigate whether the amount of corrosion depends either on the coating or on the type of soil, 12 pieces of pipe are selected. Each piece is coated with one of the four coatings and buried in one of the three types of soil for a fixed time, after which the amount of corrosion (depth of maximum...
Consider the accompanying data on breaking load (kg/25 mm width) for various fabrics in both an...
 Consider the accompanying data on breaking load (kg/25 mm width) for various fabrics in both an unabraded condition and an abraded condition. Test Ho: 4 = 0 versus Ha: u > 0 at significance level 0.01. Fabric 1 2 3 4 5 6 7 8 U 36.4 55.0 51.3 38.8 43.2 48.8 25.6 49.8 A 28.5 20.0 46.0 34.0 36.5 52.5 26.5 46.5 Calculate the test statistic and determine the P-value. (Round your test statistic to two decimal places and...
will rate!! show good work plz Consider the accompanying data on breaking load (kg/25 mm width) for various fabrics in both an unabraded (U) condition and an abraded (A) condition. Use the paire...
 will rate!!
show good work plz
Consider the accompanying data on breaking load (kg/25 mm width) for various fabrics in both an unabraded (U) condition and an abraded (A) condition. Use the paired t test to test Ho: μ D 0 versus Ha-Po > 0 at significance level 0.01, (Use μο μυΑ.) Note: The data below is formatted such that you can copy and paste it into R Fabric uc36.2, 55.0, 89 43.2, 488, 25.6, 49.9) A- 28.5, 20.0,46.0 34.0,...
will rate!!
show good work plz
Consider the accompanying data on breaking load (kg/25 mm width) for various fabrics in both an unabraded (U) condition and an abraded (A) condition. Use the paired t test to test Ho: μ D 0 versus Ha-Po > 0 at significance level 0.01, (Use μο μυΑ.) Note: The data below is formatted such that you can copy and paste it into R Fabric uc36.2, 55.0, 89 43.2, 488, 25.6, 49.9) A- 28.5, 20.0,46.0 34.0,...
 The accompanying data was obtained in an experiment to investigate whether compressive strength of concrete cylinders depends on the type of capping material used (factor A) or variability in different batches (factor 8). Each number is a cell total (x,y) based on K = 3 observations. 1 1 1846 1778 1804 2 1941 1850 Batch 3 1935 1792 1890 4 1889 1785 1892 5 1799 1626 1757 Capping Material 2 3 1892 In addition, EDX 2 = 16,810,777 and 2x...
 An experiment was carried out to investigate the effect of species (factor A, with I = 4) and grade (factor B, with ) = 3) on breaking strength of wood specimens. One observation was made for each species-grade combination-resulting in SSA = 444.0, SSB = 423.6, and SSE = 127.4. Assume that an additive model is appropriate. (a) Test Ho: a = a 2 = az = Q 4 = 0 (no differences in true average strength due to species)...
 An experiment was carried out to investigate the effect of species (factor A, with I = 4) and grade (factor B, with ) = 3) on breaking strength of wood specimens. One observation was made for each species-grade combination-resulting in SSA = 443.0, SSB = 428.6, and SSE = 122.4. Assume that an additive model is appropriate. (a) Test Ho: a1 = a2 = 03 = 24 = 0 (no differences in true average strength due to species) versus Ha:...
 ANSWER IS EITHER A OR B
ANSWER IS EITHER B OR D
Consider the accompanying data on breaking load (kg/25 mm width) for various fabrics in both an unabraded condition and an abraded condition. Use the paired t test to test Ho: HD0 sus H: HD > 0 at significance level 0.01. (Use Fabric 1 36.3 28.5 2 55.0 20.0 3 51.1 46.0 4 38.7 34.0 5 43.2 36.0 6 48.8 52.5 7 25.6 26.5 8 49.5 46.5 Calculate the...
ANSWER IS EITHER A OR B
ANSWER IS EITHER B OR D
Consider the accompanying data on breaking load (kg/25 mm width) for various fabrics in both an unabraded condition and an abraded condition. Use the paired t test to test Ho: HD0 sus H: HD > 0 at significance level 0.01. (Use Fabric 1 36.3 28.5 2 55.0 20.0 3 51.1 46.0 4 38.7 34.0 5 43.2 36.0 6 48.8 52.5 7 25.6 26.5 8 49.5 46.5 Calculate the...
 strength of polymer latex modified mortar (Portland cement mortar to which polymer latex emulsions have been added during miing) to that o unmodified mortar resulted in x 18.16 kgt/cm2 for the modified mortar (m 42) and y tension bond strengths for the modified and unmodified -16.87 kgf/cm2 for the unm dined mortar (n = 30). Let μ1 and», be the true average mortars, respectively. Assume that the bond strength distributions are both normal. (a) Assuming that σ1 1.6 and σ2-1.3,...
 Four different coatings are being considered for corrosion protection of metal pipe. The pipe will be buried in three different types of soil. To investigate whether the amount of corrosion depends either on the coating or on the type of soil, 12 pieces of pipe are selected. Each piece is coated with one of the four coatings and buried in one of the three types of soil for a fixed time, after which the amount of corrosion (depth of maximum...
 Consider the accompanying data on breaking load (kg/25 mm width) for various fabrics in both an unabraded condition and an abraded condition. Test Ho: 4 = 0 versus Ha: u > 0 at significance level 0.01. Fabric 1 2 3 4 5 6 7 8 U 36.4 55.0 51.3 38.8 43.2 48.8 25.6 49.8 A 28.5 20.0 46.0 34.0 36.5 52.5 26.5 46.5 Calculate the test statistic and determine the P-value. (Round your test statistic to two decimal places and...
 will rate!!
show good work plz
Consider the accompanying data on breaking load (kg/25 mm width) for various fabrics in both an unabraded (U) condition and an abraded (A) condition. Use the paired t test to test Ho: μ D 0 versus Ha-Po > 0 at significance level 0.01, (Use μο μυΑ.) Note: The data below is formatted such that you can copy and paste it into R Fabric uc36.2, 55.0, 89 43.2, 488, 25.6, 49.9) A- 28.5, 20.0,46.0 34.0,...
will rate!!
show good work plz
Consider the accompanying data on breaking load (kg/25 mm width) for various fabrics in both an unabraded (U) condition and an abraded (A) condition. Use the paired t test to test Ho: μ D 0 versus Ha-Po > 0 at significance level 0.01, (Use μο μυΑ.) Note: The data below is formatted such that you can copy and paste it into R Fabric uc36.2, 55.0, 89 43.2, 488, 25.6, 49.9) A- 28.5, 20.0,46.0 34.0,...
Most questions answered within 3 hours.
-
Tennis champion Maria Sharapova is capable of serving a tennis
ball at 126 mph.
b) What...
asked 3 minutes ago -
The electric potential V in the space between the plates of a
given vacuum tube is...
asked 13 minutes ago -
The Hydroboration-Oxidation of an Alkene to Yield 1-Octanol.
1-octene to 1-octanol using BH3-THF
What might be...
asked 18 minutes ago -
You draw and keep a single bill from a hat that contains a
$11, $55, $20...
asked 35 minutes ago -
Write a Java program that has the following methods:
findSum - a method that takes in...
asked 36 minutes ago -
A coffee cup calorimeter initially contains 135g of water at
22.0oC. Calcium chloride (21.0g) at the...
asked 39 minutes ago -
A patient is having a magnetic resonance imaging scan (an MRI)
and has neglected to remove...
asked 41 minutes ago -
A student takes a multiple-choice test that has 10 questions.
Each question has two choices. The...
asked 1 hour ago -
Willie Keeler has a lifetime batting average of 0.341. Assume
that Willie Keeler came to bat...
asked 1 hour ago -
Which of the following has the highest boiling point?
A) 0.5m NaCl
B) 0.5m C6H12O6
C)...
asked 1 hour ago -
12. A firm is producing at an output level where
AR = MC > AC >...
asked 1 hour ago -
Radovilsky Manufacturing Company, in Hayward, California,
makes flashing lights for toys. The company operates its production...
asked 1 hour ago