
Homework Answers
Add Answer to:
3. Test the indicated claim about the means of two populations. Assume that the two samples...
Question 16 4 pts Test the indicated daim about the means of two populations. Assume that...
 Question 16 4 pts Test the indicated daim about the means of two populations. Assume that the two samples are independent simple random samples selected from normally distributed populations Two types of flares are tested and their burning times in minutes are recorded. The summary statistics are given below. Use any method to determine if there is a significant difference in the burning times of the flares using a significance level of 0.05. Beady Brand X n-1 40 1-0 min...
Test the indicated claim about the means of two populations. Assume that the two samples are...
 Test the indicated claim about the means of two populations. Assume that the two samples are independent an have been randomly selected. 3) Two types of flares are tested for their burning times (in minutes) and sample results are 3). given below. Brand X Brand Y n=35 n = 40 x = 19.4 x = 15.1 s = 1.4 s 0.8 Refer to the sample data to test the claim that the two populations have equal means. Use a 0.05...
ject 4 Test the indicated claim about the means of two populations. Assume that the two...
 ject 4 Test the indicated claim about the means of two populations. Assume that the two samples are independent simple random samples selected from normally distributed populations. Do not assume that the population standard deviations are equal. Use the traditional method or P-value method as indicated 11) A researcher was interested in comparing the salaries of female and male employees at a 11) particular company. Independent simple random samples of 8 female employees and 15 male employees yielded the following...
A) Test the claim that the two samples are from populations with the same mean. What are the null...
 A) Test the claim that the two samples are from populations with
the same mean.
What are the null and alternative hypotheses?
1)P Value
2)Test statistic
3)state the conclusion for the test
b. Construct a confidence interval suitable for testing the
claim that the two samples are from populations with the same
mean.
Treatment Placebo A study was done using a treatment group and a placebo group The results are shown in the table Assume that the two samples are...
A) Test the claim that the two samples are from populations with
the same mean.
What are the null and alternative hypotheses?
1)P Value
2)Test statistic
3)state the conclusion for the test
b. Construct a confidence interval suitable for testing the
claim that the two samples are from populations with the same
mean.
Treatment Placebo A study was done using a treatment group and a placebo group The results are shown in the table Assume that the two samples are...
Test the indicated claim about the means of two populations. Assume that the two samples are...
Test the indicated claim about the means of two populations. Assume that the two samples are independent simple random samples selected from normally distributed populations. Do not assume that the population standard deviations are equal. Use the traditional method or P-value method as indicated. A researcher was interested in comparing the response times of two different cab companies. Companies A and B were each called at 50 randomly selected times. The calls to company A were made independently of the...
Assume that the two samples are independent simple random samples selected from normally distributed populations. Do...
 Assume that the two samples are independent simple random samples selected from normally distributed populations. Do not assume that the population standard deviations are equal Refer to the accompanying data set. Use a 0.05 significance level to test the claim that women and me Click the icon to view the data for diastolic blood pressure for men and women Data for Diastolic Blood Pressure of Men and Women Let , be the mean diastolic blood pressure for women and let...
Test the indicated claim about the means of two populations. Assume that the two samples are independent simple random samples selected from normally distributed populations. Do not assume that the po...
Test the indicated claim about the means of two populations. Assume that the two samples are independent simple random samples selected from normally distributed populations. Do not assume that the population standard deviations are equal. Use the traditional method or P-value method as indicated. A researcher was interested in comparing the response times of two different cab companies. Companies A and B were each called at 50 randomly selected times. The calls to company A were made independently of the...
For the following test, assume that the two samples are independent simple random samples selected from...
 For the following test, assume that the two samples are independent simple random samples selected from normally distributed populations and that the population standard deviations are equal (1 = 02) so that the standard error of the difference between means is obtained by pooling the sample variances. A researcher was interested in comparing the amount of time spent studying baboons by women and men from a group of anthropologists. Independent simple random samples of 32 women and 30 men were...
Find the indicated critical z value. the value of zan that corresponds to a confidence level...
 Find the indicated critical z value. the value of zan that corresponds to a confidence level of 97 80% Use the given degree of confidence 2) Of 88 selected and sample data to construct a confidence interval for the population proportion p adults selected randomly from one town 69 have health insurance. Find a 90% confidence interval for the true proportion of all adults in the town who have health insurance the given degree of confidence and sample data to...
hi how do you get the t value in the cal ti83 Test the indicated claim...
 hi
how do you get the t value in the cal ti83
Test the indicated claim about the means of two populations. Assume that the two samples are independent and that they have been randomly selected. 3) Two types of flares are tested for their burning times (in minutes) and sample results are 3 given below. Brand X n35 x=19.4 $ 1.4 Brand Y n = 40 x 15.1 S0.8 Refer to the sample data to test the claim that...
hi
how do you get the t value in the cal ti83
Test the indicated claim about the means of two populations. Assume that the two samples are independent and that they have been randomly selected. 3) Two types of flares are tested for their burning times (in minutes) and sample results are 3 given below. Brand X n35 x=19.4 $ 1.4 Brand Y n = 40 x 15.1 S0.8 Refer to the sample data to test the claim that...
 Question 16 4 pts Test the indicated daim about the means of two populations. Assume that the two samples are independent simple random samples selected from normally distributed populations Two types of flares are tested and their burning times in minutes are recorded. The summary statistics are given below. Use any method to determine if there is a significant difference in the burning times of the flares using a significance level of 0.05. Beady Brand X n-1 40 1-0 min...
 Test the indicated claim about the means of two populations. Assume that the two samples are independent an have been randomly selected. 3) Two types of flares are tested for their burning times (in minutes) and sample results are 3). given below. Brand X Brand Y n=35 n = 40 x = 19.4 x = 15.1 s = 1.4 s 0.8 Refer to the sample data to test the claim that the two populations have equal means. Use a 0.05...
 ject 4 Test the indicated claim about the means of two populations. Assume that the two samples are independent simple random samples selected from normally distributed populations. Do not assume that the population standard deviations are equal. Use the traditional method or P-value method as indicated 11) A researcher was interested in comparing the salaries of female and male employees at a 11) particular company. Independent simple random samples of 8 female employees and 15 male employees yielded the following...
 A) Test the claim that the two samples are from populations with
the same mean.
What are the null and alternative hypotheses?
1)P Value
2)Test statistic
3)state the conclusion for the test
b. Construct a confidence interval suitable for testing the
claim that the two samples are from populations with the same
mean.
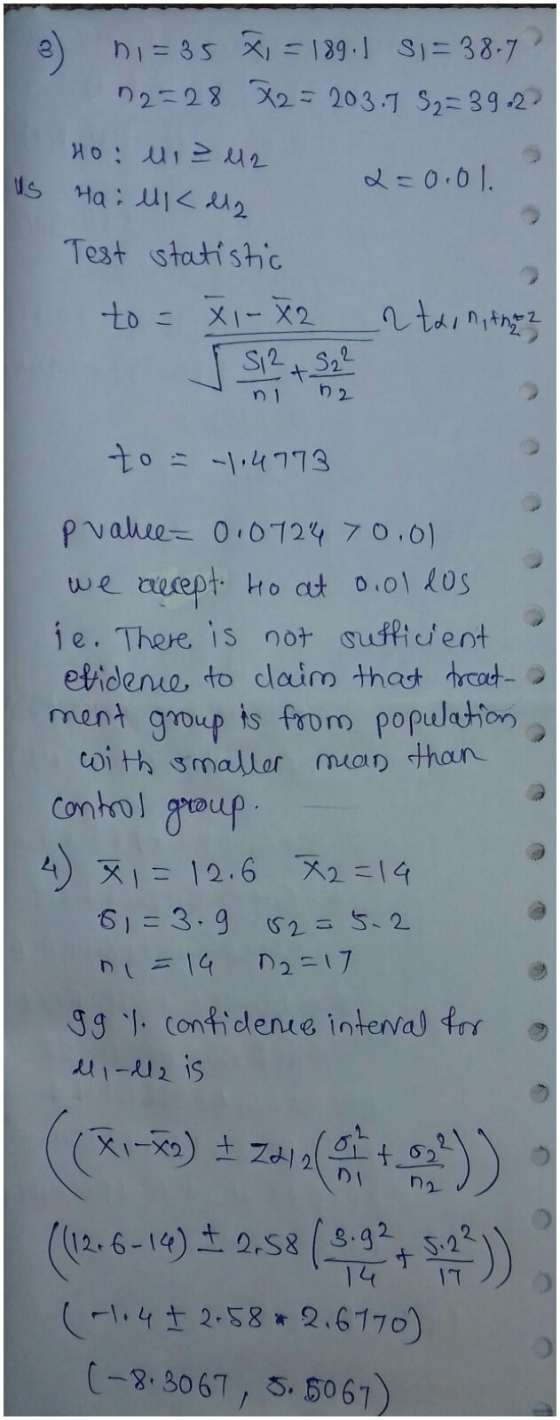
Treatment Placebo A study was done using a treatment group and a placebo group The results are shown in the table Assume that the two samples are...
A) Test the claim that the two samples are from populations with
the same mean.
What are the null and alternative hypotheses?
1)P Value
2)Test statistic
3)state the conclusion for the test
b. Construct a confidence interval suitable for testing the
claim that the two samples are from populations with the same
mean.
Treatment Placebo A study was done using a treatment group and a placebo group The results are shown in the table Assume that the two samples are...
 Assume that the two samples are independent simple random samples selected from normally distributed populations. Do not assume that the population standard deviations are equal Refer to the accompanying data set. Use a 0.05 significance level to test the claim that women and me Click the icon to view the data for diastolic blood pressure for men and women Data for Diastolic Blood Pressure of Men and Women Let , be the mean diastolic blood pressure for women and let...
 For the following test, assume that the two samples are independent simple random samples selected from normally distributed populations and that the population standard deviations are equal (1 = 02) so that the standard error of the difference between means is obtained by pooling the sample variances. A researcher was interested in comparing the amount of time spent studying baboons by women and men from a group of anthropologists. Independent simple random samples of 32 women and 30 men were...
 Find the indicated critical z value. the value of zan that corresponds to a confidence level of 97 80% Use the given degree of confidence 2) Of 88 selected and sample data to construct a confidence interval for the population proportion p adults selected randomly from one town 69 have health insurance. Find a 90% confidence interval for the true proportion of all adults in the town who have health insurance the given degree of confidence and sample data to...
 hi
how do you get the t value in the cal ti83
Test the indicated claim about the means of two populations. Assume that the two samples are independent and that they have been randomly selected. 3) Two types of flares are tested for their burning times (in minutes) and sample results are 3 given below. Brand X n35 x=19.4 $ 1.4 Brand Y n = 40 x 15.1 S0.8 Refer to the sample data to test the claim that...
hi
how do you get the t value in the cal ti83
Test the indicated claim about the means of two populations. Assume that the two samples are independent and that they have been randomly selected. 3) Two types of flares are tested for their burning times (in minutes) and sample results are 3 given below. Brand X n35 x=19.4 $ 1.4 Brand Y n = 40 x 15.1 S0.8 Refer to the sample data to test the claim that...
Most questions answered within 3 hours.
-
Koo argues that the Japanese economy in the 1990s suffered from
a balance sheet recession. What...
asked 8 minutes ago -
Automobile mechanics conduct diagnosis tests on 150 new cars of
particular make and model to determine...
asked 2 minutes ago -
11) Find the proceeds of a 5 year non-interest
bearing note for $6500 discounted 2.5 years...
asked 9 minutes ago -
If
the more comprehensive data is available in MEPS, why does the NHIS
still exist? How...
asked 15 minutes ago -
Required: Prepare the consolidated financial statements of
Griffin Ltd at 30 June 2019.
Griffin Ltd is...
asked 18 minutes ago -
1.How large must the coefficient of static friction be between
the tires and the road if...
asked 33 minutes ago -
What is the time complexity (Big-O) of the following code?
class Main
{
// Recursive...
asked 33 minutes ago -
Economists look at any situation in terms of its component
parts: the people making decisions, the...
asked 39 minutes ago -
What is a population?
Select one:
a. All of the individual organisms belonging to the same...
asked 43 minutes ago -
You have a yeast cell culture with a concentration of 5x10^4
cells/ml. If you dilute this...
asked 47 minutes ago -
In which direction the Reaction goes? Show detailed process.
SeO3 + 2ClO2. + 2H3O <---> Se...
asked 1 hour ago -
Unexposed silver halides are removed from photographic film when
they react with sodium thiosulfate
(Na2S2O3, called...
asked 1 hour ago