


Please show work as well if you can, thank you.
Homework Answers
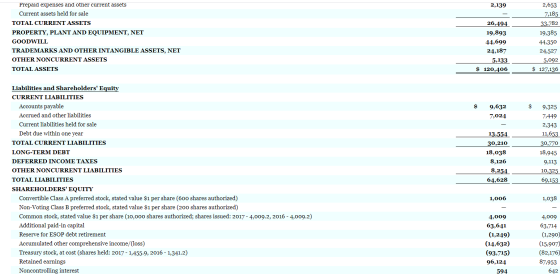
Working Capital = Current Assets - Current liabilities
Working capital
2017 = 26494 - 30210 = - 3716
2016 = 33782 - 30770 = 3012
Net cash from oprating
2017 = 12753
2016 = 15435
2015 = 14608
Net cash from investing
2017 = -5689
2016 = -5575
Net cash from financing
2017 = -8568
2016 = -9213
From 2015 to 2016 net cash from operating increased by:
(15435 - 14608)/14608 = 5.7%
From 2016 to 2017 net cash from operating increased by:
(12753-15435)/15435 = -17.4%
Current Cash Debt Coverage ratio
Current Cash Debt Coverage ratio = net Cash provided by operating activities ÷ Average total current liabilities
where,
Average total current liabilities = (current liabilities of previous year + current liabilities of this year) ÷ 2
For 2017,
Average total current liabilities = (30770 + 30210)/2 = 30490
Current Cash Debt Coverage ratio = 12753 / 30490 = 0.42
Cash Debt Coverage ratio
Cash Debt Coverage ratio = net Cash provided by operating activities ÷ total liabilities
total liabilities for 2017 = 64628
Cash Debt Coverage ratio = 12753 / 64628
Cash Debt Coverage ratio = 0.2
Free Cash FLow
Free Cash FLow =
Tax rate for the company = income taxes / earning from continous operation before income taxes (Income statement)
Tax rate for the company = 3063/13257 = 23.1%
Tax shield on interest expense = Tax rate as calculated above x Net interest expense
Tax shield on interest expense = 23.1% x 404 = 93.34
Free Cash FLow = 12753 + 404 - 93.34 - 3384
Free Cash FLow = 9679.66
Add Answer to:
Please show work as well if you can, thank you.
. Appendix B Specimen Financial Statements:...
2016 2017 $ 65,058 32,535 18,568 $ 65,299 32,909 18,949 13,441 579 182 Amounts in millions...
 2016 2017 $ 65,058 32,535 18,568 $ 65,299 32,909 18,949 13,441 579 182 Amounts in millions except per share amounts; Years ended June 30 NET SALES Cost of products sold Selling, general and administrative expense Venezuela deconsolidation charge OPERATING INCOME Interest expense Interest income Other non-operating income/(expense), net EARNINGS FROM CONTINUING OPERATIONS BEFORE INCOME TAXES Income taxes on continuing operations NET EARNINGS FROM CONTINUING OPERATIONS NET EARNINGS/(LOSS) FROM DISCONTINUED OPERATIONS NET EARNINGS Less: Net earnings attributable to noncontrolling interests NET...
Calculate the company's debt to total assets ratio (also called total debt ratio) for both the...
 Calculate the company's debt to total assets ratio (also called total debt ratio) for both the recent year and the prior year. Show your computations. Write the textbook formula here: Recent year: Prior year: Explain what information this ratio provides (define), and what the results mean to this company. Use complete sentences and your own words. Compare the two, has the ratio improved? The Procter& Gamble Company 37 Consolidated Statements of Earnings 2018 2017 2016 NET SALES S 66,832 S...
Need Help Answering (Cash Flow) Consolidated Statements of Cash Flows 2017 7,102 2016 6,836 2015 8,548...
 Need Help Answering (Cash Flow)
Consolidated Statements of Cash Flows 2017 7,102 2016 6,836 2015 8,548 $ $ $ 10,604 3,078 7,144 3,134 15,411 2,820 543 351 (601) (5,490) 337 — Amounts in millions: Years ended June 30 CASH AND CASH EQUIVALENTS, BEGINNING OF YEAR OPERATING ACTIVITIES Net earnings Depreciation and amortization Loss on early extinguishment of debt Share-based compensation expense Deferred income taxes Gain on sale of assets Venezuela deconsolidation charge Goodwill and intangible asset impairment charges Change in...
Need Help Answering (Cash Flow)
Consolidated Statements of Cash Flows 2017 7,102 2016 6,836 2015 8,548 $ $ $ 10,604 3,078 7,144 3,134 15,411 2,820 543 351 (601) (5,490) 337 — Amounts in millions: Years ended June 30 CASH AND CASH EQUIVALENTS, BEGINNING OF YEAR OPERATING ACTIVITIES Net earnings Depreciation and amortization Loss on early extinguishment of debt Share-based compensation expense Deferred income taxes Gain on sale of assets Venezuela deconsolidation charge Goodwill and intangible asset impairment charges Change in...
Amazon.com, Inc.’s financial statements are presented in Appendix D. . Financial statements of Wal-Mart Stores, Inc....
 Amazon.com, Inc.’s financial statements are
presented in Appendix D.
.
Financial statements of Wal-Mart Stores, Inc. are
presented in Appendix E.
(b) What conclusions concerning the management of
cash can be drawn from free cash flow for each company?
AMAZON.COM, INC. CONSOLIDATED STATEMENTS OF CASH FLOWS (in millions) Year Ended December 31, 2014 2015 8,658 $ 14,557 $ 2016 15,890 (241) 596 2,371 4,746 1,497 129 6.281 2,119 155 250 81 (119) 59 8,116 2.975 160 (20) (246) (829) (316)...
Amazon.com, Inc.’s financial statements are
presented in Appendix D.
.
Financial statements of Wal-Mart Stores, Inc. are
presented in Appendix E.
(b) What conclusions concerning the management of
cash can be drawn from free cash flow for each company?
AMAZON.COM, INC. CONSOLIDATED STATEMENTS OF CASH FLOWS (in millions) Year Ended December 31, 2014 2015 8,658 $ 14,557 $ 2016 15,890 (241) 596 2,371 4,746 1,497 129 6.281 2,119 155 250 81 (119) 59 8,116 2.975 160 (20) (246) (829) (316)...
Refer to the financial statements of The Home Depot in Appendix A. (Note: Fiscal 2016 for...
 Refer to the financial statements of The Home Depot in Appendix
A. (Note: Fiscal 2016 for The Home Depot runs from February 1,
2016, to January 29, 2017. As with many retail companies, The Home
Depot labels the period “Fiscal 2016” even though it ends in the
2017 calendar year. The label “Fiscal 2016” is appropriate because
Fiscal 2016 includes 11 months from the 2016 calendar year. The
Home Depot explains its choice of fiscal period in Note 1 to...
Refer to the financial statements of The Home Depot in Appendix
A. (Note: Fiscal 2016 for The Home Depot runs from February 1,
2016, to January 29, 2017. As with many retail companies, The Home
Depot labels the period “Fiscal 2016” even though it ends in the
2017 calendar year. The label “Fiscal 2016” is appropriate because
Fiscal 2016 includes 11 months from the 2016 calendar year. The
Home Depot explains its choice of fiscal period in Note 1 to...
Compute P&G's gross profit for each of the years 2015-2017. Explain why gross profit decreased in...
 Compute P&G's gross profit for each of the years 2015-2017.
Explain why gross profit decreased in 2017.
What are P&G's primary revenue sources
B-2 APPENDIX B Specimen Financial Statements: The Procter & Gamble Company 2017 $ 65,058 32,535 18,568 2016 2015 $ 65,299 $ 70,749 32,909 37,056 18,949 20,616 2,028 11,049 1395 Consolidated Statements of Earnings Amounts in millions except per share amounts: Years ended June 30 NET SALES Cost of products sold Selling, general and administrative expense Venezuela deconsolidation...
Compute P&G's gross profit for each of the years 2015-2017.
Explain why gross profit decreased in 2017.
What are P&G's primary revenue sources
B-2 APPENDIX B Specimen Financial Statements: The Procter & Gamble Company 2017 $ 65,058 32,535 18,568 2016 2015 $ 65,299 $ 70,749 32,909 37,056 18,949 20,616 2,028 11,049 1395 Consolidated Statements of Earnings Amounts in millions except per share amounts: Years ended June 30 NET SALES Cost of products sold Selling, general and administrative expense Venezuela deconsolidation...
Expand Your Critical Thinking 12-03 a Amazon.com, Inc.’s financial statements are presented in Appendix D. Click...
 Expand Your Critical Thinking 12-03 a Amazon.com, Inc.’s
financial statements are presented in Appendix D. Click here to
view Appendix D. Financial statements of Wal-Mart Stores, Inc. are
presented in Appendix E. Click here to view Appendix E. (a) Based
on the information contained in these financial statements,
compute free cash flow for Amazon at December 31, 2016 and
Wal-Mart for January 31, 2017. (Show a negative free cash flow with
either a - sign e.g. -15,000 or in parenthesis...
Expand Your Critical Thinking 12-03 a Amazon.com, Inc.’s
financial statements are presented in Appendix D. Click here to
view Appendix D. Financial statements of Wal-Mart Stores, Inc. are
presented in Appendix E. Click here to view Appendix E. (a) Based
on the information contained in these financial statements,
compute free cash flow for Amazon at December 31, 2016 and
Wal-Mart for January 31, 2017. (Show a negative free cash flow with
either a - sign e.g. -15,000 or in parenthesis...
Analyzing Starbucks's Balance Sheet Disclosures Keview the financial statements and related notes of Starbucks in Appendix...
 Analyzing Starbucks's Balance Sheet Disclosures Keview the financial statements and related notes of Starbucks in Appendix A. Required: Answer the following questions pertaining to Starbucks's balance sheet as of October 1, 2017, and related information. (Note: You do not need to make any calculations. All answers may be found in the financial report.) If required, round your answers to one decimal place. 1. What was the amount of the current assets and current liabilities? Current assets $ 14,365,6 X million...
Refer to the financial statements of The Home Depot in Appendix A. (Note: Fiscal 2016 for...
 Refer to the financial statements of The Home Depot in Appendix A. (Note: Fiscal 2016 for The Home Depot runs from February 1, 2016, to January 29, 2017 Required: 1. What amount of Net Sales does the company report during the year ended January 29, 2017? $32,313 $62,282 $7,957 $94,595 2. Assuming that Cost of Sales is the company's term for Cost of Goods Sold, compute the company's gross profit percentage for fiscal 2016 and the year immediately prior to...
Please follow the report and answer the following question. show work Consolidated Statements of Earnings $...
 Please follow the report and answer the following question.
show work
Consolidated Statements of Earnings $ $ in milions excent per common share amounts) Revenue Cost of products sold Gross margin 2019 145,534 138,700 6,834 2018 2010 136,809 $ 129,628 7,181 2017 129,976 123,432 6 ,544 3.775 Operating expenses: Distribution, selling, general and administrative expenses Restructuring and employee severance Amortization and other acquisition-related costs Impairments and gain loss on disposal of assets, net Litigation (recoveries)/charges, net Operating earnings 4.480 125...
Please follow the report and answer the following question.
show work
Consolidated Statements of Earnings $ $ in milions excent per common share amounts) Revenue Cost of products sold Gross margin 2019 145,534 138,700 6,834 2018 2010 136,809 $ 129,628 7,181 2017 129,976 123,432 6 ,544 3.775 Operating expenses: Distribution, selling, general and administrative expenses Restructuring and employee severance Amortization and other acquisition-related costs Impairments and gain loss on disposal of assets, net Litigation (recoveries)/charges, net Operating earnings 4.480 125...
 2016 2017 $ 65,058 32,535 18,568 $ 65,299 32,909 18,949 13,441 579 182 Amounts in millions except per share amounts; Years ended June 30 NET SALES Cost of products sold Selling, general and administrative expense Venezuela deconsolidation charge OPERATING INCOME Interest expense Interest income Other non-operating income/(expense), net EARNINGS FROM CONTINUING OPERATIONS BEFORE INCOME TAXES Income taxes on continuing operations NET EARNINGS FROM CONTINUING OPERATIONS NET EARNINGS/(LOSS) FROM DISCONTINUED OPERATIONS NET EARNINGS Less: Net earnings attributable to noncontrolling interests NET...
 Calculate the company's debt to total assets ratio (also called total debt ratio) for both the recent year and the prior year. Show your computations. Write the textbook formula here: Recent year: Prior year: Explain what information this ratio provides (define), and what the results mean to this company. Use complete sentences and your own words. Compare the two, has the ratio improved? The Procter& Gamble Company 37 Consolidated Statements of Earnings 2018 2017 2016 NET SALES S 66,832 S...
 Need Help Answering (Cash Flow)
Consolidated Statements of Cash Flows 2017 7,102 2016 6,836 2015 8,548 $ $ $ 10,604 3,078 7,144 3,134 15,411 2,820 543 351 (601) (5,490) 337 — Amounts in millions: Years ended June 30 CASH AND CASH EQUIVALENTS, BEGINNING OF YEAR OPERATING ACTIVITIES Net earnings Depreciation and amortization Loss on early extinguishment of debt Share-based compensation expense Deferred income taxes Gain on sale of assets Venezuela deconsolidation charge Goodwill and intangible asset impairment charges Change in...
Need Help Answering (Cash Flow)
Consolidated Statements of Cash Flows 2017 7,102 2016 6,836 2015 8,548 $ $ $ 10,604 3,078 7,144 3,134 15,411 2,820 543 351 (601) (5,490) 337 — Amounts in millions: Years ended June 30 CASH AND CASH EQUIVALENTS, BEGINNING OF YEAR OPERATING ACTIVITIES Net earnings Depreciation and amortization Loss on early extinguishment of debt Share-based compensation expense Deferred income taxes Gain on sale of assets Venezuela deconsolidation charge Goodwill and intangible asset impairment charges Change in...
 Amazon.com, Inc.’s financial statements are
presented in Appendix D.
.
Financial statements of Wal-Mart Stores, Inc. are
presented in Appendix E.
(b) What conclusions concerning the management of
cash can be drawn from free cash flow for each company?
AMAZON.COM, INC. CONSOLIDATED STATEMENTS OF CASH FLOWS (in millions) Year Ended December 31, 2014 2015 8,658 $ 14,557 $ 2016 15,890 (241) 596 2,371 4,746 1,497 129 6.281 2,119 155 250 81 (119) 59 8,116 2.975 160 (20) (246) (829) (316)...
Amazon.com, Inc.’s financial statements are
presented in Appendix D.
.
Financial statements of Wal-Mart Stores, Inc. are
presented in Appendix E.
(b) What conclusions concerning the management of
cash can be drawn from free cash flow for each company?
AMAZON.COM, INC. CONSOLIDATED STATEMENTS OF CASH FLOWS (in millions) Year Ended December 31, 2014 2015 8,658 $ 14,557 $ 2016 15,890 (241) 596 2,371 4,746 1,497 129 6.281 2,119 155 250 81 (119) 59 8,116 2.975 160 (20) (246) (829) (316)...
 Refer to the financial statements of The Home Depot in Appendix
A. (Note: Fiscal 2016 for The Home Depot runs from February 1,
2016, to January 29, 2017. As with many retail companies, The Home
Depot labels the period “Fiscal 2016” even though it ends in the
2017 calendar year. The label “Fiscal 2016” is appropriate because
Fiscal 2016 includes 11 months from the 2016 calendar year. The
Home Depot explains its choice of fiscal period in Note 1 to...
Refer to the financial statements of The Home Depot in Appendix
A. (Note: Fiscal 2016 for The Home Depot runs from February 1,
2016, to January 29, 2017. As with many retail companies, The Home
Depot labels the period “Fiscal 2016” even though it ends in the
2017 calendar year. The label “Fiscal 2016” is appropriate because
Fiscal 2016 includes 11 months from the 2016 calendar year. The
Home Depot explains its choice of fiscal period in Note 1 to...
 Compute P&G's gross profit for each of the years 2015-2017.
Explain why gross profit decreased in 2017.
What are P&G's primary revenue sources
B-2 APPENDIX B Specimen Financial Statements: The Procter & Gamble Company 2017 $ 65,058 32,535 18,568 2016 2015 $ 65,299 $ 70,749 32,909 37,056 18,949 20,616 2,028 11,049 1395 Consolidated Statements of Earnings Amounts in millions except per share amounts: Years ended June 30 NET SALES Cost of products sold Selling, general and administrative expense Venezuela deconsolidation...
Compute P&G's gross profit for each of the years 2015-2017.
Explain why gross profit decreased in 2017.
What are P&G's primary revenue sources
B-2 APPENDIX B Specimen Financial Statements: The Procter & Gamble Company 2017 $ 65,058 32,535 18,568 2016 2015 $ 65,299 $ 70,749 32,909 37,056 18,949 20,616 2,028 11,049 1395 Consolidated Statements of Earnings Amounts in millions except per share amounts: Years ended June 30 NET SALES Cost of products sold Selling, general and administrative expense Venezuela deconsolidation...
 Expand Your Critical Thinking 12-03 a Amazon.com, Inc.’s
financial statements are presented in Appendix D. Click here to
view Appendix D. Financial statements of Wal-Mart Stores, Inc. are
presented in Appendix E. Click here to view Appendix E. (a) Based
on the information contained in these financial statements,
compute free cash flow for Amazon at December 31, 2016 and
Wal-Mart for January 31, 2017. (Show a negative free cash flow with
either a - sign e.g. -15,000 or in parenthesis...
Expand Your Critical Thinking 12-03 a Amazon.com, Inc.’s
financial statements are presented in Appendix D. Click here to
view Appendix D. Financial statements of Wal-Mart Stores, Inc. are
presented in Appendix E. Click here to view Appendix E. (a) Based
on the information contained in these financial statements,
compute free cash flow for Amazon at December 31, 2016 and
Wal-Mart for January 31, 2017. (Show a negative free cash flow with
either a - sign e.g. -15,000 or in parenthesis...
 Analyzing Starbucks's Balance Sheet Disclosures Keview the financial statements and related notes of Starbucks in Appendix A. Required: Answer the following questions pertaining to Starbucks's balance sheet as of October 1, 2017, and related information. (Note: You do not need to make any calculations. All answers may be found in the financial report.) If required, round your answers to one decimal place. 1. What was the amount of the current assets and current liabilities? Current assets $ 14,365,6 X million...
 Refer to the financial statements of The Home Depot in Appendix A. (Note: Fiscal 2016 for The Home Depot runs from February 1, 2016, to January 29, 2017 Required: 1. What amount of Net Sales does the company report during the year ended January 29, 2017? $32,313 $62,282 $7,957 $94,595 2. Assuming that Cost of Sales is the company's term for Cost of Goods Sold, compute the company's gross profit percentage for fiscal 2016 and the year immediately prior to...
 Please follow the report and answer the following question.
show work
Consolidated Statements of Earnings $ $ in milions excent per common share amounts) Revenue Cost of products sold Gross margin 2019 145,534 138,700 6,834 2018 2010 136,809 $ 129,628 7,181 2017 129,976 123,432 6 ,544 3.775 Operating expenses: Distribution, selling, general and administrative expenses Restructuring and employee severance Amortization and other acquisition-related costs Impairments and gain loss on disposal of assets, net Litigation (recoveries)/charges, net Operating earnings 4.480 125...
Please follow the report and answer the following question.
show work
Consolidated Statements of Earnings $ $ in milions excent per common share amounts) Revenue Cost of products sold Gross margin 2019 145,534 138,700 6,834 2018 2010 136,809 $ 129,628 7,181 2017 129,976 123,432 6 ,544 3.775 Operating expenses: Distribution, selling, general and administrative expenses Restructuring and employee severance Amortization and other acquisition-related costs Impairments and gain loss on disposal of assets, net Litigation (recoveries)/charges, net Operating earnings 4.480 125...
Most questions answered within 3 hours.
-
*****DO NOT ANSWER THIS QUESTION IF YOU DON'T
KNOW*******Rights and Duties of Auditors; Minimum 4000
words...
asked 43 minutes ago -
The probability that Janie is wearing sunglasses is 1/4. The
probability that she is wearing sunglasses...
asked 1 hour ago -
Do you believe social media is more of a help or a hindrance in
controlling crises...
asked 1 hour ago -
Two long, parallel wires separated by 2.85 cm carry currents in
opposite directions. The current in...
asked 1 hour ago -
Question # 1. Develop a list of rehabilitation journals
that publish articles concerning career counseling for...
asked 1 hour ago -
Bryant Company has a factory machine with a book value of
$85,100 and a remaining useful...
asked 1 hour ago -
What is the default classification for federal tax purposes of a
U.S. eligible entity with one...
asked 1 hour ago -
1. How many grams would 4.0x10²¹ atoms of calcium
weigh?
2.. Calculate the percent oxygen in...
asked 1 hour ago -
Balance Equation
K2Cr2O7 + H2C2O4 2H2O 6 K[Cr(C2O4 )2 (H2O)2 ]2H2O + CO2 +
H2O
asked 1 hour ago -
Select a position in the clinical laboratory and write an
appropriate job description and corresponding work...
asked 1 hour ago -
Targeting the Bottom of the Pyramid
What are some of the broader societal pricing concerns faced...
asked 1 hour ago -
Which of the following statements is correct? (3 marks)
a) Upon the public announcement of finding...
asked 1 hour ago