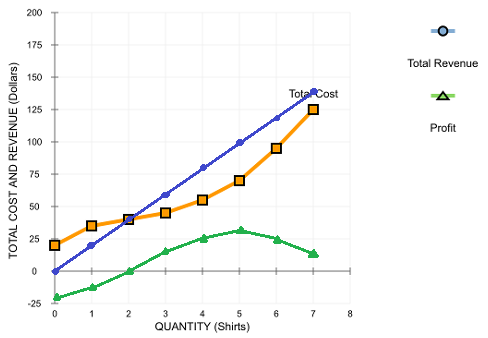
Suppose Manuel runs a small business that manufactures shirts. Assume that the market for shirts is a competitive market, and the market price is $20 per shirt.


Homework Answers
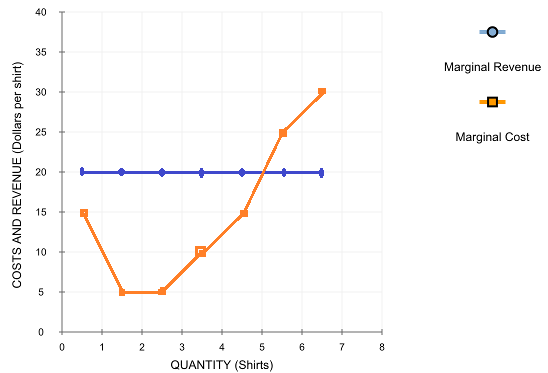
| Q | TC | TR | Profit | MC | MR |
| 0 | 20 | 0 | -20 | ||
| 1 | 35 | 20 | -15 | 15 | 20 |
| 2 | 40 | 40 | 0 | 5 | 20 |
| 3 | 45 | 60 | 15 | 5 | 20 |
| 4 | 55 | 80 | 25 | 10 | 20 |
| 5 | 70 | 100 | 30 | 15 | 20 |
| 6 | 95 | 120 | 25 | 25 | 20 |
| 7 | 125 | 140 | 15 | 30 | 20 |
Blanks:
1) 5
2) 15
3) Less
4) 25
5) More
6) MC=MR
7) P=MC
Add Answer to:
Suppose Manuel runs a small business that manufactures shirts. Assume that the market for shirts is a competitive market, and the market price is $20 per shirt.
Suppose Manuel runs a small business that manufactures teddy bears. Assume that the market for teddy bears is a competitive market, and the market price is $20 per teddy bear.
 3. Profit maximization using total cost and total revenue curves Suppose Manuel runs a small business that manufactures teddy bears. Assume that the market for teddy bears is a competitive market, and the market price is $20 per teddy bear. The following graph shows Manuel's total cost curve. Use the blue points (circle symbol) to plot total revenue and the green points (triangle symbol) to plot profit for teddy bears quantities zero through seven (inclusive) that Manuel produces.TOTAL COSTQUANTITY2003514024535547059561257 Calculate Manuel's marginal revenue and...
Suppose Carlos runs a small business that manufactures frying pans. Assume that the market for frying pans is a price-taker market, and the market price is $10 per frying pan.
 Suppose Carlos runs a small business that manufactures frying pans. Assume that the market for frying pans is a price-taker market, and the market price is $10 per frying pan.The following graph shows Carlos's total cost curve.Use the blue points (circle symbol) to plot total revenue, and the green points (triangle symbol) to plot profit for the first seven frying pans that Carlos produces, including zero frying pans.Calculate Carlos's marginal revenue and marginal cost for the first seven frying pans...
Suppose Janet runs a small business that manufactures fryingpans. Assume that the market for frying...
 Suppose Janet runs a small business that manufactures frying
pans. Assume that the market for frying pans is a competitive
market, and the market price is $20 per frying pan.The following graph shows Janet's total cost curve.Use the blue points (circle symbol) to plot total revenue and
the green points (triangle symbol) to plot profit for frying pans
quantities zero through seven (inclusive) that Janet produces. Calculate Janet's marginal revenue and marginal cost for the first seven frying pans she produces,...
Suppose Janet runs a small business that manufactures frying
pans. Assume that the market for frying pans is a competitive
market, and the market price is $20 per frying pan.The following graph shows Janet's total cost curve.Use the blue points (circle symbol) to plot total revenue and
the green points (triangle symbol) to plot profit for frying pans
quantities zero through seven (inclusive) that Janet produces. Calculate Janet's marginal revenue and marginal cost for the first seven frying pans she produces,...
Suppose Caroline runs a small business that manufactures teddy bears. Assume that the market for teddy...
 Suppose Caroline runs a small business that manufactures teddy bears. Assume that the market for teddy bears is a competitive market, and the market price is $25 per teddy bear. The following graph shows Caroline's total cost curve. Use the blue points (circle symbol) to plot total revenue and the green points (triangle symbol) to plot profit for teddy bears quantities zero through seven (inclusive) that Caroline produces. Total Revenue Total Cost Profit TOTAL COST AND REVENUE (Dollars) 0 1...
| 20 | Sam runs a small steam-cleaning business. Assume the market for steam cleaning is...
 | 20 | Sam runs a small steam-cleaning business. Assume the market for steam cleaning is perfectly competitive. Suppose Sam's cost structure is given by the following table. Average Average Total Quantity Variable Cost Total Cost Marginal Cost Variable Cost Cost $0 $50 -- 1 2 80 3 45 95 31.67 - 4 62 112 15.50 5 90 140 6 132 182 30.33 186 236 26.57 33.71 a. Fill in the table above. 30 | | | | | +...
A t-shirt store in a monopolistically competitive market faces a demand curve for t-shirts given by...
A t-shirt store in a monopolistically competitive market faces a demand curve for t-shirts given by P = 25 – 0.5Q (and so a marginal revenue of MR = 25 – Q). The variable costs of producing a t-shirt are VC = 3Q and so the marginal costs are constant at $3. If the t-shirt store is in a long-run equilibrium, what must its fixed costs be? $308 $242 $66 $418 $14
Suppose that the market for dress shirts is a competitive market. The following graph shows the...
 Suppose that the market for dress shirts is a competitive market. The following graph shows the daily cost curves of a firm operating in this market. Hint: After placing the rectangle on the graph, you can select an endpoint to see the coordinates of that point. 50 45 Profit or Loss 40 35 30 25 20 AVC 10 0 46 810 2 4 16 1820 QUANTITY (Thousands of shirts per day) On the preceding graph, use the blue rectangle (circle...
Teddy bears is a competitive market, and the market price is $20 per teddy bear
 Teddy bears is a competitive market, and the market price is $20 per teddy bear The following graph shows Andrew's total cost curve. Use the blue points (circle symbol) to plot total revenue and the green points (triangle symbol) to plot profit for teddy bears quantities zero through seven (inclusive) that Andrew produces. Calculate Andrew's marginal revenue and marginal cost for the first seven teddy bears he produces, and plot them on the following graph. Use the blue points (circle symbol) to plot...
Suppose that the market for dress shirts is a perfectly competitive market. The following graph shows...
 Suppose that the market for dress shirts is a perfectly competitive market. The following graph shows the daily cost curves of a firm operating in this market Profit or Loss PRICE Dolars per shit) QUANTITY (Thousands of shirts) PRICE (DC 4 6 8 10 12 QUANTITY (Thousands of shirts) In the short run, at a market price of $15 per shirt, this firm will choose to produce shirts per day. On the previous graph, use the blue rectangle (circle symbols)...
Suppose that a firm operates in a competitive market where the commodity price is $12 per...
Suppose that a firm operates in a competitive market where the commodity price is $12 per unit. The firms cost equation is C=15+.4Q^2, where C= total cost and Q= quantity. a) find the profit maximizing level of output for the firm. Determine its level of profit.
 Suppose Caroline runs a small business that manufactures teddy bears. Assume that the market for teddy bears is a competitive market, and the market price is $25 per teddy bear. The following graph shows Caroline's total cost curve. Use the blue points (circle symbol) to plot total revenue and the green points (triangle symbol) to plot profit for teddy bears quantities zero through seven (inclusive) that Caroline produces. Total Revenue Total Cost Profit TOTAL COST AND REVENUE (Dollars) 0 1...
 | 20 | Sam runs a small steam-cleaning business. Assume the market for steam cleaning is perfectly competitive. Suppose Sam's cost structure is given by the following table. Average Average Total Quantity Variable Cost Total Cost Marginal Cost Variable Cost Cost $0 $50 -- 1 2 80 3 45 95 31.67 - 4 62 112 15.50 5 90 140 6 132 182 30.33 186 236 26.57 33.71 a. Fill in the table above. 30 | | | | | +...
 Suppose that the market for dress shirts is a competitive market. The following graph shows the daily cost curves of a firm operating in this market. Hint: After placing the rectangle on the graph, you can select an endpoint to see the coordinates of that point. 50 45 Profit or Loss 40 35 30 25 20 AVC 10 0 46 810 2 4 16 1820 QUANTITY (Thousands of shirts per day) On the preceding graph, use the blue rectangle (circle...
 Suppose that the market for dress shirts is a perfectly competitive market. The following graph shows the daily cost curves of a firm operating in this market Profit or Loss PRICE Dolars per shit) QUANTITY (Thousands of shirts) PRICE (DC 4 6 8 10 12 QUANTITY (Thousands of shirts) In the short run, at a market price of $15 per shirt, this firm will choose to produce shirts per day. On the previous graph, use the blue rectangle (circle symbols)...
Most questions answered within 3 hours.
-
Write a program to solve the Josephus problem, with the following
modification:
Sample Input:
./a.out n...
asked 1 hour ago -
At the start of a CD it is spinning at a rate of 525 rpm
(revolutions...
asked 1 hour ago -
4. Without doing any calculations, predict whether the observed
∆T would increase, decrease or remain the...
asked 2 hours ago -
Based on the range, which of the following sets of scores has
the greatest variability? 3,...
asked 4 hours ago -
Ripples in a pond travel at a velocity of 3 m/s with one peak
passing a...
asked 3 hours ago -
A man stands on the roof of a building of height 13.0 mm and
throws a...
asked 4 hours ago -
The extent to which assets are financed by borrowed funds and
other liabilities is indicated by:...
asked 5 hours ago -
Explain in detail
Germany is the fifth largest economy
explain what goods and services Germany specializes...
asked 5 hours ago -
The density of platinum is 21.45 g/mL. If a cube of platinum
with a mass of...
asked 5 hours ago -
Accounts Receivable
Sales
A/R Posting
Extended Sales Invoice
Packing Slip
Compare invoice to packing slip 2...
asked 5 hours ago -
Michaella, age 23, is a full-time law student and is claimed by
her parents as a...
asked 5 hours ago -
Why are polymers not typically casted into products?
asked 5 hours ago