
Homework Answers
Answer
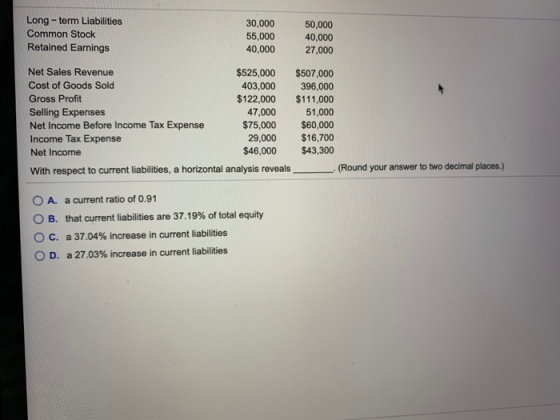
(C) a 37.04% increase in current liability
Explanation
Under horzontal analysis comparison is done for Financial Ratios ,or any single item of 2 or more different Periods.
So for Current liabilities calculations will be done as follows
Current liability for year 2018 is $54000
Current liability for year 2019 is $74000
So for horizonal analysis we shall calculate Precentage increase in Current liability
{($74000-$54000)/$54000} x 100 ={$20000/$54000} x 100 = 37.037% or 37.04%
Therefore with respect to current liabilities Horizontal analysis reveals a 37.04% increase in current liability.
Thank You
Please give a Thumbs UP
Add Answer to:
same question had to scroll down
This Question: 2 pts 9 of 21 (1 complete) The...
6 of 40 (3 complete) The following is summary of information presented on the financial statements...
 6 of 40 (3 complete) The following is summary of information presented on the financial statements of a company on December 31, 2019. Account 2019 2018 Current Assets $66,000 $55,000 Accounts Receivable 80,000 80,000 Merchandise Inventory 51,000 45,000 Current Liabilities 72,000 57,000 Long-term Liabilities 33,000 55,000 Common Stock 51,000 41,000 Retained Earnings 41,000 27,000 Net Sales Revenue Cost of Goods Sold $526,000 401,000 $500,000 399,000 O A. a 26.32% increase in current liabilities OB. that current liabilities are 36.55% of...
This Question: 1 pt 23 of 48 (2 complete) on the 20172016 Current Assets Merchandise Inventory...
 This Question: 1 pt 23 of 48 (2 complete) on the 20172016 Current Assets Merchandise Inventory Long- term Liabilities Retained Earnings Net Sales Revenue $70,000 $52,000 84,000 75,000 52,000 43,000 79,000 53,000 34,000 52,000 51,000 40,000 42,000 25,000 $530,000 $500,000 400,000 399,000 Cost of Goods Sold A. a 32.91% increase in current liabilities B. a 49 06% increase in current liabilities C. a current ratio of 0 89 0 D. that current liabilities are 38 35% of total equity Click...
same question had to scroll Pizza, Inc. provides the following data: 2019 2018 Assets Current Assets:...
 same question had to scroll
Pizza, Inc. provides the following data: 2019 2018 Assets Current Assets: Cash and Cash Equivalents Accounts Receivable, Net Merchandise Inventory Total Current Assets Property, Plant, and Equipment, Net Total Assets $31,000 $25,000 38,000 62,000 59,000 50,000 $128,000 137,000 $120,000 120,000 $248,000 $257,000 For the year ending December 31, 2019: Net Credit Sales $540,000 A. 0.69 times B. 1.07 times C. 2.14 times OD. 4.22 times Click to select your answer. is Question: 2 pts VURUVI....
same question had to scroll
Pizza, Inc. provides the following data: 2019 2018 Assets Current Assets: Cash and Cash Equivalents Accounts Receivable, Net Merchandise Inventory Total Current Assets Property, Plant, and Equipment, Net Total Assets $31,000 $25,000 38,000 62,000 59,000 50,000 $128,000 137,000 $120,000 120,000 $248,000 $257,000 For the year ending December 31, 2019: Net Credit Sales $540,000 A. 0.69 times B. 1.07 times C. 2.14 times OD. 4.22 times Click to select your answer. is Question: 2 pts VURUVI....
E5.17 (LO 2, 3) (Preparation of a Statement of Cash Flows and a Balance Sheet) Grant...
 E5.17 (LO 2, 3) (Preparation of a Statement of Cash Flows and a Balance Sheet) Grant Wood Corporation's balance sheet at the end of 2019 included the following items. Current assets (Cash $82,000) $235,000 Current liabilities $150,000 Land 30,000 Bonds payable 100,000 Buildings 120,000 Common stock 180,000 Equipment 90,000 Retained earnings 44,000 Accum. depr.--buildings (30,000) Total $474,000 Accum. depr.-equipment (11,000) Patents 40,000 $474,000 The following information is available for 2020. 1. Net income was $55,000. 2. Equipment (cost $20,000 and...
Prepare a statement of Cash Flow for the current year using the indirect method Robust Robots,...
 Prepare a statement of Cash Flow for the current year using
the indirect method
Robust Robots, Inc. Comparative Balance Sheet December 31, 2019 and 2018 2019 2018 Assets Current Assets: Cash Accounts Receivable, net Merchandise Inventory Supplies Prepaid Insurance Total Current Assets $ $ $ $ $ $ 65,000 150,000 135,000 9,700 30,000 389,700 $ $ $ $ $ $ 80,000 100,000 70,000 500 10,000 260,500 Property, Plant, and Equipment: Equipment Less: Accumulated Depreciation - Equipment Total Property, plant, and...
Prepare a statement of Cash Flow for the current year using
the indirect method
Robust Robots, Inc. Comparative Balance Sheet December 31, 2019 and 2018 2019 2018 Assets Current Assets: Cash Accounts Receivable, net Merchandise Inventory Supplies Prepaid Insurance Total Current Assets $ $ $ $ $ $ 65,000 150,000 135,000 9,700 30,000 389,700 $ $ $ $ $ $ 80,000 100,000 70,000 500 10,000 260,500 Property, Plant, and Equipment: Equipment Less: Accumulated Depreciation - Equipment Total Property, plant, and...
Prepare a Satement of Cash Flow for the current year usinf the indirect method. Robust Robots,...
 Prepare a Satement of Cash Flow for the current year usinf the
indirect method.
Robust Robots, Inc. Comparative Balance Sheet December 31, 2019 and 2018 2019 2018 Assets Current Assets: Cash Accounts Receivable, net Merchandise Inventory Supplies Prepaid Insurance Total Current Assets $ $ $ $ $ $ 65,000 150,000 135,000 9,700 30,000 389,700 $ $ $ $ $ $ 80,000 100,000 70,000 500 10,000 260,500 Property, Plant, and Equipment: Equipment Less: Accumulated Depreciation - Equipment Total Property, plant, and...
Prepare a Satement of Cash Flow for the current year usinf the
indirect method.
Robust Robots, Inc. Comparative Balance Sheet December 31, 2019 and 2018 2019 2018 Assets Current Assets: Cash Accounts Receivable, net Merchandise Inventory Supplies Prepaid Insurance Total Current Assets $ $ $ $ $ $ 65,000 150,000 135,000 9,700 30,000 389,700 $ $ $ $ $ $ 80,000 100,000 70,000 500 10,000 260,500 Property, Plant, and Equipment: Equipment Less: Accumulated Depreciation - Equipment Total Property, plant, and...
Prepare a Statement of Cash Flow for the current year using the indirect method Robust Robots,...
 Prepare a Statement of Cash Flow for the current year using
the indirect method
Robust Robots, Inc. Comparative Balance Sheet December 31, 2019 and 2018 2019 2018 Assets Current Assets: Cash Accounts Receivable, net Merchandise Inventory Supplies Prepaid Insurance Total Current Assets $ $ $ $ $ $ 65,000 150,000 135,000 9,700 30,000 389,700 $ $ $ $ $ $ 80,000 100,000 70,000 500 10,000 260,500 Property, Plant, and Equipment: Equipment Less: Accumulated Depreciation - Equipment Total Property, plant, and...
Prepare a Statement of Cash Flow for the current year using
the indirect method
Robust Robots, Inc. Comparative Balance Sheet December 31, 2019 and 2018 2019 2018 Assets Current Assets: Cash Accounts Receivable, net Merchandise Inventory Supplies Prepaid Insurance Total Current Assets $ $ $ $ $ $ 65,000 150,000 135,000 9,700 30,000 389,700 $ $ $ $ $ $ 80,000 100,000 70,000 500 10,000 260,500 Property, Plant, and Equipment: Equipment Less: Accumulated Depreciation - Equipment Total Property, plant, and...
Prepare a Cash Flow Statement. Robust Robots, Inc. Comparative Balance Sheet December 31, 2019 and 2018...
 Prepare a Cash Flow Statement.
Robust Robots, Inc. Comparative Balance Sheet December 31, 2019 and 2018 2018 2019 $ Assets Current Assets: Cash Accounts Receivable, net Merchandise Inventory Supplies Prepaid Insurance Total Current Assets 65,000 150,000 135,000 9,700 30,000 389,700 $ $ $ $ $ $ 80,000 100,000 70,000 500 10,000 260,500 $ Property, plant, and Equipment: Equipment Less: Accumulated Depreciation - Equipment Total Property, Plant, and Equipment Total Assets $ $ $ $ 500,000 (80,000) 420,000 809,700 $ $...
Prepare a Cash Flow Statement.
Robust Robots, Inc. Comparative Balance Sheet December 31, 2019 and 2018 2018 2019 $ Assets Current Assets: Cash Accounts Receivable, net Merchandise Inventory Supplies Prepaid Insurance Total Current Assets 65,000 150,000 135,000 9,700 30,000 389,700 $ $ $ $ $ $ 80,000 100,000 70,000 500 10,000 260,500 $ Property, plant, and Equipment: Equipment Less: Accumulated Depreciation - Equipment Total Property, Plant, and Equipment Total Assets $ $ $ $ 500,000 (80,000) 420,000 809,700 $ $...
The 2019 financial statements for Growth Industries are presented below. INCOME STATEMENT, 2019 Sales Costs EBIT...
 The 2019 financial statements for Growth Industries are presented below. INCOME STATEMENT, 2019 Sales Costs EBIT Interest expense Taxable income Taxes (at 21%) Net income Dividends $17,380 Addition to retained earnings $17,380 $210,000 155,000 $ 55,000 11,000 $ 44,000 9,240 $ 34,760 Assets Current assets Cash Accounts receivable Inventories Total current assets Net plant and equipment $ 11,000 $ 11,000 110,000 BALANCE SHEET, YEAR-END, 2019 Liabilities Current liabilities $ 4,000 Accounts payable 9,000 Total current liabilities 27,000 Long-term debt $...
Prepare a Cash Flow statement using indirect method Robust Robots, Inc. Comparative Balance Sheet December 31,...
 Prepare a Cash Flow statement using indirect method
Robust Robots, Inc. Comparative Balance Sheet December 31, 2019 and 2018 Assets 2019 2018 Current Assets: Cash Accounts Receivable, net Merchandise Inventory Supplies Prepaid Insurance Total Current Assets $ $ $ $ $ 65,000 150,000 135,000 9,700 30,000 389,700 $ $ $ $ $ $ 80,000 100,000 70,000 500 10,000 260,500 Property, Plant, and Equipment: Equipment Less: Accumulated Depreciation - Equipment Total Property, Plant, and Equipment Total Assets 500,000 (80,000) 420,000 809,700...
Prepare a Cash Flow statement using indirect method
Robust Robots, Inc. Comparative Balance Sheet December 31, 2019 and 2018 Assets 2019 2018 Current Assets: Cash Accounts Receivable, net Merchandise Inventory Supplies Prepaid Insurance Total Current Assets $ $ $ $ $ 65,000 150,000 135,000 9,700 30,000 389,700 $ $ $ $ $ $ 80,000 100,000 70,000 500 10,000 260,500 Property, Plant, and Equipment: Equipment Less: Accumulated Depreciation - Equipment Total Property, Plant, and Equipment Total Assets 500,000 (80,000) 420,000 809,700...
 6 of 40 (3 complete) The following is summary of information presented on the financial statements of a company on December 31, 2019. Account 2019 2018 Current Assets $66,000 $55,000 Accounts Receivable 80,000 80,000 Merchandise Inventory 51,000 45,000 Current Liabilities 72,000 57,000 Long-term Liabilities 33,000 55,000 Common Stock 51,000 41,000 Retained Earnings 41,000 27,000 Net Sales Revenue Cost of Goods Sold $526,000 401,000 $500,000 399,000 O A. a 26.32% increase in current liabilities OB. that current liabilities are 36.55% of...
 This Question: 1 pt 23 of 48 (2 complete) on the 20172016 Current Assets Merchandise Inventory Long- term Liabilities Retained Earnings Net Sales Revenue $70,000 $52,000 84,000 75,000 52,000 43,000 79,000 53,000 34,000 52,000 51,000 40,000 42,000 25,000 $530,000 $500,000 400,000 399,000 Cost of Goods Sold A. a 32.91% increase in current liabilities B. a 49 06% increase in current liabilities C. a current ratio of 0 89 0 D. that current liabilities are 38 35% of total equity Click...
 same question had to scroll
Pizza, Inc. provides the following data: 2019 2018 Assets Current Assets: Cash and Cash Equivalents Accounts Receivable, Net Merchandise Inventory Total Current Assets Property, Plant, and Equipment, Net Total Assets $31,000 $25,000 38,000 62,000 59,000 50,000 $128,000 137,000 $120,000 120,000 $248,000 $257,000 For the year ending December 31, 2019: Net Credit Sales $540,000 A. 0.69 times B. 1.07 times C. 2.14 times OD. 4.22 times Click to select your answer. is Question: 2 pts VURUVI....
same question had to scroll
Pizza, Inc. provides the following data: 2019 2018 Assets Current Assets: Cash and Cash Equivalents Accounts Receivable, Net Merchandise Inventory Total Current Assets Property, Plant, and Equipment, Net Total Assets $31,000 $25,000 38,000 62,000 59,000 50,000 $128,000 137,000 $120,000 120,000 $248,000 $257,000 For the year ending December 31, 2019: Net Credit Sales $540,000 A. 0.69 times B. 1.07 times C. 2.14 times OD. 4.22 times Click to select your answer. is Question: 2 pts VURUVI....
 E5.17 (LO 2, 3) (Preparation of a Statement of Cash Flows and a Balance Sheet) Grant Wood Corporation's balance sheet at the end of 2019 included the following items. Current assets (Cash $82,000) $235,000 Current liabilities $150,000 Land 30,000 Bonds payable 100,000 Buildings 120,000 Common stock 180,000 Equipment 90,000 Retained earnings 44,000 Accum. depr.--buildings (30,000) Total $474,000 Accum. depr.-equipment (11,000) Patents 40,000 $474,000 The following information is available for 2020. 1. Net income was $55,000. 2. Equipment (cost $20,000 and...
 Prepare a statement of Cash Flow for the current year using
the indirect method
Robust Robots, Inc. Comparative Balance Sheet December 31, 2019 and 2018 2019 2018 Assets Current Assets: Cash Accounts Receivable, net Merchandise Inventory Supplies Prepaid Insurance Total Current Assets $ $ $ $ $ $ 65,000 150,000 135,000 9,700 30,000 389,700 $ $ $ $ $ $ 80,000 100,000 70,000 500 10,000 260,500 Property, Plant, and Equipment: Equipment Less: Accumulated Depreciation - Equipment Total Property, plant, and...
Prepare a statement of Cash Flow for the current year using
the indirect method
Robust Robots, Inc. Comparative Balance Sheet December 31, 2019 and 2018 2019 2018 Assets Current Assets: Cash Accounts Receivable, net Merchandise Inventory Supplies Prepaid Insurance Total Current Assets $ $ $ $ $ $ 65,000 150,000 135,000 9,700 30,000 389,700 $ $ $ $ $ $ 80,000 100,000 70,000 500 10,000 260,500 Property, Plant, and Equipment: Equipment Less: Accumulated Depreciation - Equipment Total Property, plant, and...
 Prepare a Satement of Cash Flow for the current year usinf the
indirect method.
Robust Robots, Inc. Comparative Balance Sheet December 31, 2019 and 2018 2019 2018 Assets Current Assets: Cash Accounts Receivable, net Merchandise Inventory Supplies Prepaid Insurance Total Current Assets $ $ $ $ $ $ 65,000 150,000 135,000 9,700 30,000 389,700 $ $ $ $ $ $ 80,000 100,000 70,000 500 10,000 260,500 Property, Plant, and Equipment: Equipment Less: Accumulated Depreciation - Equipment Total Property, plant, and...
Prepare a Satement of Cash Flow for the current year usinf the
indirect method.
Robust Robots, Inc. Comparative Balance Sheet December 31, 2019 and 2018 2019 2018 Assets Current Assets: Cash Accounts Receivable, net Merchandise Inventory Supplies Prepaid Insurance Total Current Assets $ $ $ $ $ $ 65,000 150,000 135,000 9,700 30,000 389,700 $ $ $ $ $ $ 80,000 100,000 70,000 500 10,000 260,500 Property, Plant, and Equipment: Equipment Less: Accumulated Depreciation - Equipment Total Property, plant, and...
 Prepare a Statement of Cash Flow for the current year using
the indirect method
Robust Robots, Inc. Comparative Balance Sheet December 31, 2019 and 2018 2019 2018 Assets Current Assets: Cash Accounts Receivable, net Merchandise Inventory Supplies Prepaid Insurance Total Current Assets $ $ $ $ $ $ 65,000 150,000 135,000 9,700 30,000 389,700 $ $ $ $ $ $ 80,000 100,000 70,000 500 10,000 260,500 Property, Plant, and Equipment: Equipment Less: Accumulated Depreciation - Equipment Total Property, plant, and...
Prepare a Statement of Cash Flow for the current year using
the indirect method
Robust Robots, Inc. Comparative Balance Sheet December 31, 2019 and 2018 2019 2018 Assets Current Assets: Cash Accounts Receivable, net Merchandise Inventory Supplies Prepaid Insurance Total Current Assets $ $ $ $ $ $ 65,000 150,000 135,000 9,700 30,000 389,700 $ $ $ $ $ $ 80,000 100,000 70,000 500 10,000 260,500 Property, Plant, and Equipment: Equipment Less: Accumulated Depreciation - Equipment Total Property, plant, and...
 Prepare a Cash Flow Statement.
Robust Robots, Inc. Comparative Balance Sheet December 31, 2019 and 2018 2018 2019 $ Assets Current Assets: Cash Accounts Receivable, net Merchandise Inventory Supplies Prepaid Insurance Total Current Assets 65,000 150,000 135,000 9,700 30,000 389,700 $ $ $ $ $ $ 80,000 100,000 70,000 500 10,000 260,500 $ Property, plant, and Equipment: Equipment Less: Accumulated Depreciation - Equipment Total Property, Plant, and Equipment Total Assets $ $ $ $ 500,000 (80,000) 420,000 809,700 $ $...
Prepare a Cash Flow Statement.
Robust Robots, Inc. Comparative Balance Sheet December 31, 2019 and 2018 2018 2019 $ Assets Current Assets: Cash Accounts Receivable, net Merchandise Inventory Supplies Prepaid Insurance Total Current Assets 65,000 150,000 135,000 9,700 30,000 389,700 $ $ $ $ $ $ 80,000 100,000 70,000 500 10,000 260,500 $ Property, plant, and Equipment: Equipment Less: Accumulated Depreciation - Equipment Total Property, Plant, and Equipment Total Assets $ $ $ $ 500,000 (80,000) 420,000 809,700 $ $...
 The 2019 financial statements for Growth Industries are presented below. INCOME STATEMENT, 2019 Sales Costs EBIT Interest expense Taxable income Taxes (at 21%) Net income Dividends $17,380 Addition to retained earnings $17,380 $210,000 155,000 $ 55,000 11,000 $ 44,000 9,240 $ 34,760 Assets Current assets Cash Accounts receivable Inventories Total current assets Net plant and equipment $ 11,000 $ 11,000 110,000 BALANCE SHEET, YEAR-END, 2019 Liabilities Current liabilities $ 4,000 Accounts payable 9,000 Total current liabilities 27,000 Long-term debt $...
 Prepare a Cash Flow statement using indirect method
Robust Robots, Inc. Comparative Balance Sheet December 31, 2019 and 2018 Assets 2019 2018 Current Assets: Cash Accounts Receivable, net Merchandise Inventory Supplies Prepaid Insurance Total Current Assets $ $ $ $ $ 65,000 150,000 135,000 9,700 30,000 389,700 $ $ $ $ $ $ 80,000 100,000 70,000 500 10,000 260,500 Property, Plant, and Equipment: Equipment Less: Accumulated Depreciation - Equipment Total Property, Plant, and Equipment Total Assets 500,000 (80,000) 420,000 809,700...
Prepare a Cash Flow statement using indirect method
Robust Robots, Inc. Comparative Balance Sheet December 31, 2019 and 2018 Assets 2019 2018 Current Assets: Cash Accounts Receivable, net Merchandise Inventory Supplies Prepaid Insurance Total Current Assets $ $ $ $ $ 65,000 150,000 135,000 9,700 30,000 389,700 $ $ $ $ $ $ 80,000 100,000 70,000 500 10,000 260,500 Property, Plant, and Equipment: Equipment Less: Accumulated Depreciation - Equipment Total Property, Plant, and Equipment Total Assets 500,000 (80,000) 420,000 809,700...
Most questions answered within 3 hours.
-
Q. The market demand function is D(Pd) = 160 - 2Pd and the
market supply function...
asked 1 minute ago -
An unknown alcohol is analyzed by freezing point depression. The
unknown is either methanol (CH3OH), ethanol...
asked 2 minutes ago -
As a person inhales, air moves down the windpipe (bronchus),
through a constriction where the air...
asked 4 minutes ago -
Youngchang Keyboard sells a $1400 keyboard on a monthly payment
plan over 2 years.
a) If...
asked 11 minutes ago -
For a one step reaction, the activation energy for the
forward reaction is 40.0 kJ mol-1,...
asked 14 minutes ago -
1. A good thesis statement _____ .
is limited but not too narrow
is very broad...
asked 9 minutes ago -
What is the main use of a transistor and what is an Integrated
Circuit?
asked 16 minutes ago -
Intro to Java Programming
Write a method named isDivisible that takes two integers, n
and m,...
asked 15 minutes ago -
Calculate whether loci A&B are in linkage disequilibrium
(D) using the following data. Is the haplotype...
asked 34 minutes ago -
Barrington Box Enterprises has two divisions, large and small,
that share the common costs of the...
asked 38 minutes ago -
An integer number is said to be a perfect number if it is equal
to the...
asked 49 minutes ago -
What does economies of scale often fail to measure? How would
you recommend addressing this limitation?
asked 49 minutes ago