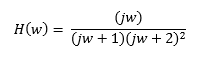
Sketch the approximate Bode plot (magnitude and phase) of the transfer function
Homework Answers


Add Answer to:
Sketch the approximate Bode plot (magnitude and phase) of the
transfer function
(jw) H(W) = (w...
Provide the Bode plot (sketch the gain |H(jw) and the phase shift ZH(jw)) of a system...
 Provide the Bode plot (sketch the gain |H(jw) and the phase shift ZH(jw)) of a system with the following transfer function: (10 + jw) H(jw) = jw(5 + jw)
Find the transfer function H(s) for the circuit below. Make s=jw and plot the Bode plot...
 Find the transfer function H(s) for the circuit below. Make s=jw
and plot the Bode plot (magnitude and phase response) for the
transfer function.
C = out 페
Find the transfer function H(s) for the circuit below. Make s=jw
and plot the Bode plot (magnitude and phase response) for the
transfer function.
C = out 페
Sketch the magnitude characteristic of the Bode plot for the transfer function (3 marks) G(0) =...
 Sketch the magnitude characteristic of the Bode plot for the transfer function (3 marks) G(0) = -02.104 (jo+1)2.jw+10)-(+100)
1. (a) sketch the Bode magnitude and phase plots of a transfer function T(W) = Vo(w)...
 1. (a) sketch the Bode magnitude and phase plots of a transfer function T(W) = Vo(w) given Wo = 27x1oʻrad/s. Vi (w) (l+ges/wo2 g (6) Calculate the half-power or 3-dB Cut-off frequency of the above transfer function, and the phase LT(W) at the 3-dB cut-off frequency.
Sketch the bode plot of a signal conditioner with the transfer function G(s) in the provided...
 Sketch the bode plot of a signal conditioner with the transfer function G(s) in the provided graph and calculate the bandwidth of this signal conditioner. GO 10s +1 S2 + 10s + 24 Table 2 Components in G(S) Asymptotes for Magnitude Asymptotes for Phase 20 log,0 1G(jw) Frequency-rad/sec Phase - degrees Frequency - rad/sec
3. Draw the Bode plot (magnitude and phase) for the transfer function H(s) of a CT...
 3. Draw the Bode plot (magnitude and phase) for the transfer function H(s) of a CT LTI given by H(s) 4000 only the asymptotic plot of the terms that make up the transfer function but also show the composite plot that adds all the terms that make up the transfer function. S+2000s+10 where the ROC includes the ja axis. Show
For the following transfer function, sketch approximate straight-line Bode plots, including magnitude and phase plots. Show...
 For the following transfer function, sketch approximate
straight-line Bode plots, including magnitude and phase plots. Show
all steps clearly
10 4 (A)G(s)-7 s (s 2s +100)
For the following transfer function, sketch approximate
straight-line Bode plots, including magnitude and phase plots. Show
all steps clearly
10 4 (A)G(s)-7 s (s 2s +100)
Sketch the straight-line approximation Bode plot diagrams (magnitude and phase) 110s for H[s] You might want...
 Sketch the straight-line approximation Bode plot diagrams (magnitude and phase) 110s for H[s] You might want to examine Examples E.1 and E.2 in (s+10)(s+100)´ the textbook. Based on your straight-line Bode plot sketch, answer the following questions. The questions are: a. Identify the transfer function written in time constant form. b. The phase of H[s] at low frequencies is? c. The magnitude plot has what slope at low frequencies? d. The magnitude plot has what slope at high frequencies? e....
Chapter 12, Problem 12.21 (Multistep) Part 1 Correct. Sketch the magnitude characteristic of the Bode plot...
 Chapter 12, Problem 12.21 (Multistep) Part 1 Correct. Sketch the magnitude characteristic of the Bode plot for the transfer function 30(0.060 * jo + 1) jojo + 1)(0.0024 * ja + 1) H0) = Shown here is the radian frequency axis for w > 0. The labeled frequencies represent the break frequencies in the transfer function H(o) (not necessarily drawn to scale). -+ W + w W3 W (rad/sec) What are the numerical values of the break frequencies w1, wz,...
Sketch the approximate Bode magnitude and phase plots for the following transfer functions by hand. a....
 Sketch the approximate Bode magnitude and phase plots for the following transfer functions by hand. a. G(s) b. G(s)- 200 (s2 +2s)(0.1s +1) s+1 s2 +2s +100
 Provide the Bode plot (sketch the gain |H(jw) and the phase shift ZH(jw)) of a system with the following transfer function: (10 + jw) H(jw) = jw(5 + jw)
 Find the transfer function H(s) for the circuit below. Make s=jw
and plot the Bode plot (magnitude and phase response) for the
transfer function.
C = out 페
Find the transfer function H(s) for the circuit below. Make s=jw
and plot the Bode plot (magnitude and phase response) for the
transfer function.
C = out 페
 Sketch the magnitude characteristic of the Bode plot for the transfer function (3 marks) G(0) = -02.104 (jo+1)2.jw+10)-(+100)
 1. (a) sketch the Bode magnitude and phase plots of a transfer function T(W) = Vo(w) given Wo = 27x1oʻrad/s. Vi (w) (l+ges/wo2 g (6) Calculate the half-power or 3-dB Cut-off frequency of the above transfer function, and the phase LT(W) at the 3-dB cut-off frequency.
 Sketch the bode plot of a signal conditioner with the transfer function G(s) in the provided graph and calculate the bandwidth of this signal conditioner. GO 10s +1 S2 + 10s + 24 Table 2 Components in G(S) Asymptotes for Magnitude Asymptotes for Phase 20 log,0 1G(jw) Frequency-rad/sec Phase - degrees Frequency - rad/sec
 3. Draw the Bode plot (magnitude and phase) for the transfer function H(s) of a CT LTI given by H(s) 4000 only the asymptotic plot of the terms that make up the transfer function but also show the composite plot that adds all the terms that make up the transfer function. S+2000s+10 where the ROC includes the ja axis. Show
 For the following transfer function, sketch approximate
straight-line Bode plots, including magnitude and phase plots. Show
all steps clearly
10 4 (A)G(s)-7 s (s 2s +100)
For the following transfer function, sketch approximate
straight-line Bode plots, including magnitude and phase plots. Show
all steps clearly
10 4 (A)G(s)-7 s (s 2s +100)
 Sketch the straight-line approximation Bode plot diagrams (magnitude and phase) 110s for H[s] You might want to examine Examples E.1 and E.2 in (s+10)(s+100)´ the textbook. Based on your straight-line Bode plot sketch, answer the following questions. The questions are: a. Identify the transfer function written in time constant form. b. The phase of H[s] at low frequencies is? c. The magnitude plot has what slope at low frequencies? d. The magnitude plot has what slope at high frequencies? e....
 Chapter 12, Problem 12.21 (Multistep) Part 1 Correct. Sketch the magnitude characteristic of the Bode plot for the transfer function 30(0.060 * jo + 1) jojo + 1)(0.0024 * ja + 1) H0) = Shown here is the radian frequency axis for w > 0. The labeled frequencies represent the break frequencies in the transfer function H(o) (not necessarily drawn to scale). -+ W + w W3 W (rad/sec) What are the numerical values of the break frequencies w1, wz,...
 Sketch the approximate Bode magnitude and phase plots for the following transfer functions by hand. a. G(s) b. G(s)- 200 (s2 +2s)(0.1s +1) s+1 s2 +2s +100
Most questions answered within 3 hours.
-
Little’s Law: Val d’Costa is a world famous ski village in the
French Alps. Because of...
asked 22 minutes ago -
Find the absolute error D for the calculation if A + B/C=D A=
9.4 +/- 0.4...
asked 35 minutes ago -
New Air Heating and Cooling, manufactures furnaces and central
air units. The company pride itself on...
asked 49 minutes ago -
A coach uses a new technique to train gymnasts. Seven
gymnasts were randomly selected and their...
asked 2 hours ago -
While rotating the tires on your car you notice a rock [mass =
0.1 Kg] stuck...
asked 4 hours ago -
Using MARS simulator, write MIPS programs according to
the following scenarios: Receive a positive integer number...
asked 6 hours ago -
An object in front of a concave mirror has a real image that is
11.5 cm...
asked 6 hours ago -
Consider the reaction, C3 H8 + O2 --> CO2 + H2O. How many
moles of O2...
asked 8 hours ago -
You and your opponent both roll a fair die. If you both roll the
same number,...
asked 8 hours ago -
In a study of the accuracy of fast food drive-through orders,
Restaurant A had 257 accurate...
asked 8 hours ago -
Identify and describe in detail the four categories of
institutions that could be included in a...
asked 8 hours ago -
In python
class Customer:
def __init__(self, customer_id, last_name, first_name, phone_number, address):
self._customer_id = int(customer_id)
self._last_name =...
asked 9 hours ago