
Homework Answers
For the distribution


Mean is calculated as:
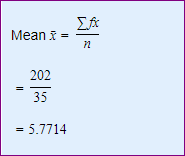
Mean=5.77
Add Answer to:
stimate the mean of the number of items purchased by randomly selected customers at a clothing...
30 The manager of the local Walmart Superright is studying the number of items purchased by...
 30 The manager of the local Walmart Superright is studying the number of items purchased by customers in the evening hours. Listed below is the number of items for a sample of 30 customers. 15 12 5 8 4 6 6 7 11 9 8 14 9 12 5 4 10 6 18 10 6 10 11 5 10 9 13 12 13 5 2 01:40:06 Click here for the Excel Data File a. Find the mean and the median...
A survey of 25 randomly selected customers found the ages shown (in years). The mean is...
 A survey of 25 randomly selected customers found the ages shown (in years). The mean is 32.00 years and the standard deviation is 9.99 3 years. a Construct a 99% confidence interval for the mean age of all customers, assuming that the assumptions and conditions or the con interval have been met b) How large is the margin of error? c) How would the confidence interval change i you had assumed that the standard deviation was known to be 10.0...
Estimate the mean of the number of french fries ordered daily at a restaurant over the...
 Estimate the mean of the number of french fries ordered daily at a restaurant over the past few weeks given in the following grouped frequency table. • Round the final answer to two decimal places Frequency Value Interval 3-5 6-8 9.11 12-14 15-17
The manager of The Cheesecake Factory in Boston reports that on six randomly selected weekdays, the...
The manager of The Cheesecake Factory in Boston reports that on six randomly selected weekdays, the number of customers served was 175, 125, 180, 220, 240, and 245. She believes that the number of customers served on weekdays follows a normal distribution. Construct the 99% confidence interval for the average number of customers served on weekdays. Use Table 2. (Round intermediate calculations to 4 decimal places, "sample mean" and "sample standard deviation" to 2 decimal places. Round "t" value to...
A clothing store uses comment cards to get feedback from its customers about newly added items....
 A clothing store uses comment cards to get feedback from its customers about newly added items. It recently introduced plus size fashion wear. Customers who purchased the items were asked to fill out an online comment survey giving 10% off the next purchase. The data are summarized in the table below. What percentage of customers would be less likely to purchase another item (Less or Not fully satisfied)? Response Very satisfied Satisfied Less than fully satisfied. Not satisfied Frequency 15...
The manager of The Cheesecake Factory in Boston reports that on six randomly selected weekdays, the...
The manager of The Cheesecake Factory in Boston reports that on six randomly selected weekdays, the number of customers served was 125, 110, 220, 280, 130, and 240. She believes that the number of customers served on weekdays follows a normal distribution. Construct the 99% confidence interval for the average number of customers served on weekdays. (You may find it useful to reference the t table. Round intermediate calculations to at least 4 decimal places, "sample mean" and "sample standard...
Due Sunday. Apr 14 All answers will be saved automatically pm PDT All Question1 A high school tea...
 Due Sunday. Apr 14 All answers will be saved automatically pm PDT All Question1 A high school teacher is interested to compare the average time for students to complete a standardized test for three different classes of students The teacher coll classes and the dataset is provided below. lects random data for time to complete the standardized test (in minutes) for students in three different The teacher is interested to know if the average time to complete the standardized test...
A store owner surveyed 25 randomly selected customers and found the ages shown (in years). The...
 A store owner surveyed 25 randomly selected customers and found the ages shown (in years). The mean is 32.36 and the standard deviation is 11.79. The owner wants to know f the mean age of all customers is 36 years old. Use the given information to complete parts a through . 14 12 18 22 16 42 48 44 28 40 41 3743 44 38 16 20 39 48 31 30 34 21 47 36 a) What is the null...
The mean bill of 16 randomly selected customers in a restaurant is found to be $32,...
The mean bill of 16 randomly selected customers in a restaurant is found to be $32, with a standard deviation of $3.50. Construct a 99% confidence interval for the mean bill of a customer.
A store owner surveyed 25 randomly selected customers and found the ages shown (in years). The...
 A store owner surveyed 25 randomly selected customers and found the ages shown (in years). The mean is 27.8 and the standard deviation is 8.72. The owner wants to know if the mean age of all customers is 32 years old. Use the given information to complete parts a through f 30 19 23 26 23 D 31 30 23 11 50 30 20 29 18 24 29 3740 46 35 26 23 22 27 23 a) What is the...
 30 The manager of the local Walmart Superright is studying the number of items purchased by customers in the evening hours. Listed below is the number of items for a sample of 30 customers. 15 12 5 8 4 6 6 7 11 9 8 14 9 12 5 4 10 6 18 10 6 10 11 5 10 9 13 12 13 5 2 01:40:06 Click here for the Excel Data File a. Find the mean and the median...
 A survey of 25 randomly selected customers found the ages shown (in years). The mean is 32.00 years and the standard deviation is 9.99 3 years. a Construct a 99% confidence interval for the mean age of all customers, assuming that the assumptions and conditions or the con interval have been met b) How large is the margin of error? c) How would the confidence interval change i you had assumed that the standard deviation was known to be 10.0...
 Estimate the mean of the number of french fries ordered daily at a restaurant over the past few weeks given in the following grouped frequency table. • Round the final answer to two decimal places Frequency Value Interval 3-5 6-8 9.11 12-14 15-17
 A clothing store uses comment cards to get feedback from its customers about newly added items. It recently introduced plus size fashion wear. Customers who purchased the items were asked to fill out an online comment survey giving 10% off the next purchase. The data are summarized in the table below. What percentage of customers would be less likely to purchase another item (Less or Not fully satisfied)? Response Very satisfied Satisfied Less than fully satisfied. Not satisfied Frequency 15...
 Due Sunday. Apr 14 All answers will be saved automatically pm PDT All Question1 A high school teacher is interested to compare the average time for students to complete a standardized test for three different classes of students The teacher coll classes and the dataset is provided below. lects random data for time to complete the standardized test (in minutes) for students in three different The teacher is interested to know if the average time to complete the standardized test...
 A store owner surveyed 25 randomly selected customers and found the ages shown (in years). The mean is 32.36 and the standard deviation is 11.79. The owner wants to know f the mean age of all customers is 36 years old. Use the given information to complete parts a through . 14 12 18 22 16 42 48 44 28 40 41 3743 44 38 16 20 39 48 31 30 34 21 47 36 a) What is the null...
 A store owner surveyed 25 randomly selected customers and found the ages shown (in years). The mean is 27.8 and the standard deviation is 8.72. The owner wants to know if the mean age of all customers is 32 years old. Use the given information to complete parts a through f 30 19 23 26 23 D 31 30 23 11 50 30 20 29 18 24 29 3740 46 35 26 23 22 27 23 a) What is the...
Most questions answered within 3 hours.
-
Brian makes $34,100 per year. How much can Brian expect to
contribute to FICA taxes in...
asked 10 minutes ago -
To buy a new house you must borrow $155,000. To do this you take
out a...
asked 26 minutes ago -
Spacely Sprockets is evaluating the construction of a new plant
on land the company purchased for...
asked 1 hour ago -
1. Consider a linear regression model of y on K regressors and
an intercept.
(i) Describe...
asked 1 hour ago -
Enter a balanced equation for the reaction between hydrochloric
acid and sodium sulfite.
Express your answer...
asked 1 hour ago -
Give a regular expression describing the language
{x | x ∈ Σ* and x does not...
asked 1 hour ago -
Masses of 1.0 kg, 2.0 kg, and 3.0 kg are each separately subject
to a net...
asked 1 hour ago -
The mode of philosophical argumentation and thought. How do
philosophers think and write? What is important...
asked 1 hour ago -
At the beginning of the unit, you were asked whether you thought
it was appropriate or...
asked 1 hour ago -
Calculate the grams of carbon in 9.32 x 10+23 molecules of
benzene (C6H6).
asked 1 hour ago -
A 5-year Treasury bond has a 4.95% yield. A 10-year Treasury
bond yields 6.6%, and a...
asked 1 hour ago -
suppose you own a chain of five restaurants in
downtown Vancouver. as the manager, you want...
asked 2 hours ago