


Homework Answers

Add Answer to:
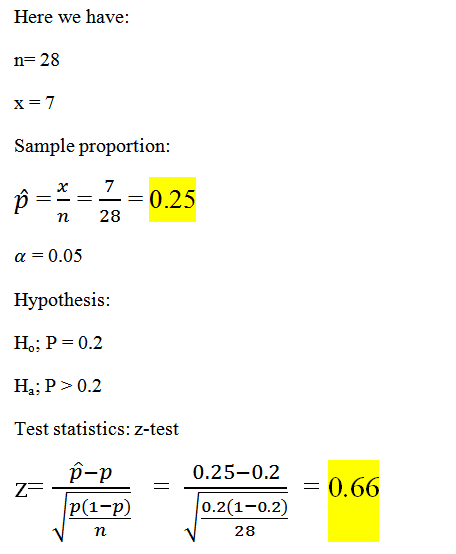
The number of successes and the sample size for a simple random sample from a population...
Normal distribution The execution times in seconds of a certain experiment have a normal distribution with...
 Normal distribution
The execution times in seconds of a certain experiment have a
normal distribution with a mean of 38 and a variance of 36.
a) What is the probability that an experiment test will last more
than 42 seconds?
b) If the test times located in the top 10% are classified as
reserved, what is the minimum time to be in this category?
c) What is the proportion of tests that have times that exceed at
least five seconds...
Normal distribution
The execution times in seconds of a certain experiment have a
normal distribution with a mean of 38 and a variance of 36.
a) What is the probability that an experiment test will last more
than 42 seconds?
b) If the test times located in the top 10% are classified as
reserved, what is the minimum time to be in this category?
c) What is the proportion of tests that have times that exceed at
least five seconds...
Please give detailed explanation how you got answers. Thank you in advance. Z table is included....
 Please give detailed explanation how you got answers.
Thank you in advance.
Z table is included. please show steps how to derive
to answer. Thank you, experts.
4. Find the following probabilities based on the standard normal variable Z. (You may find reference the z table. Round your answers to 4 decimal places.) 3.33 Doints 0.7881 0.0096 a. P(Z >08) b. PIZ-2.34) C. POSZ $ 1.57) d. P(-0.73SZ S2.81) eBook References MC Graw Hill < Prey Enfrey Next > Type...
Please give detailed explanation how you got answers.
Thank you in advance.
Z table is included. please show steps how to derive
to answer. Thank you, experts.
4. Find the following probabilities based on the standard normal variable Z. (You may find reference the z table. Round your answers to 4 decimal places.) 3.33 Doints 0.7881 0.0096 a. P(Z >08) b. PIZ-2.34) C. POSZ $ 1.57) d. P(-0.73SZ S2.81) eBook References MC Graw Hill < Prey Enfrey Next > Type...
please explain 3.3) [8 pts] A sample of 29 randomly selected automobile owners were asked to...
 please explain
3.3) [8 pts] A sample of 29 randomly selected automobile owners were asked to keep a record of the kilometers they travel. The random sample showed an average of 28,350 kilometers and a standard deviation of 5,237 kilometers. Assuming the underlying population is normally distributed, test the hypothesis that automobiles are driven on average more than 28,000 kilometers per year at the 10% level. Hou = 28,000 Hu> 28,000 First, specify: "If {inequality} we fail to reject the...
please explain
3.3) [8 pts] A sample of 29 randomly selected automobile owners were asked to keep a record of the kilometers they travel. The random sample showed an average of 28,350 kilometers and a standard deviation of 5,237 kilometers. Assuming the underlying population is normally distributed, test the hypothesis that automobiles are driven on average more than 28,000 kilometers per year at the 10% level. Hou = 28,000 Hu> 28,000 First, specify: "If {inequality} we fail to reject the...
Two questions For each of the following questions: clearly indicate the probability distribution being used to...
 Two questions
For each of the following questions: clearly indicate the probability distribution being used to solve the problem solve by hand, and verify your answer using MATLAB. 1. Two teams, A and B, play a series of games. If team B has a probability 0.4 of winning each game, is it to their advantage to play the best three out of five games or the best four out of seven, and why? Assume the outcomes of successive games are...
Two questions
For each of the following questions: clearly indicate the probability distribution being used to solve the problem solve by hand, and verify your answer using MATLAB. 1. Two teams, A and B, play a series of games. If team B has a probability 0.4 of winning each game, is it to their advantage to play the best three out of five games or the best four out of seven, and why? Assume the outcomes of successive games are...
Use the sample data and confidence level given below to complete parts (a) through (d). A...
 Use the sample data and confidence level given below to complete parts (a) through (d). A research institute poll asked respondents if they felt vulnerable to identity theft. In the poll, n=924 and x = 540 who said "yes." Use a 90% confidence level. E Click the icon to view a table of z scores. a) Find the best point estimate of the population proportion p (Round to three decimal places as needed.) b) Identify the value of the margin...
Suppose that for a very large shipment of integrated circuit chips, the probability of failure for...
 Suppose that for a very large shipment of integrated circuit chips, the probability of failure for anyone chip is 0.20. Assuming that the assumptions underlying the binomial distributions are met find the probability that at most chips fail in a random sample of 18 Cick here to view page 1 of the table of binomial probably sums Cok here to view page 2 of the table of binomial probably sums The probability at most chips fails Round to four decimal...
Al Claim: deviation = 8.2, Sample information! Variance-59.8 Sample size=55 Test the claim with 95% confidence...
 Al Claim: deviation = 8.2, Sample information! Variance-59.8 Sample size=55 Test the claim with 95% confidence TABLE 3 Cumulative Probability Cumulative Areas of the Standard Normal Distribution continued) The entries in this table are the cumulative probabilities for the standard standard deviation 1). The shaded area under the curve of the standard normal distribution represents the cumulative probability to the left of a to s-value in the left-hand tail. 1 0.02 00 01 02 03 04 18 0.00 0.01 0.03...
8.4.22 :3 Question Help The heights of 1000 students are approximately normally distributed with a mean...
 8.4.22 :3 Question Help The heights of 1000 students are approximately normally distributed with a mean of 177.7 centimeters and a standard deviation of 7.2 centimeters. Suppose 200 random samples of size 25 are drawn from this population and the means recorded to the nearest tenth of a centimeter. Complete parts (a) through (c) below. Click here to view page 1 of the standard normal distribution table. Click here to view page 2 of the standard normal distribution table. 0...
these two questions im having trouble on. Provides the tables for both M 6.2.75 се Use...
 these two questions im having trouble on. Provides the tables
for both
M 6.2.75 се Use a standard normal distribution table to obtain the Z-score that has an area of 0.975 to its right. Click here to view page 1 of the normal distribution table, As Click here to view page 2 of the normal distribution table. Za St (Round to two decimal places as needed.) normal distribution page 1 Areas under the standard normal curve Second decimal place in...
these two questions im having trouble on. Provides the tables
for both
M 6.2.75 се Use a standard normal distribution table to obtain the Z-score that has an area of 0.975 to its right. Click here to view page 1 of the normal distribution table, As Click here to view page 2 of the normal distribution table. Za St (Round to two decimal places as needed.) normal distribution page 1 Areas under the standard normal curve Second decimal place in...
Consider the following hypotheses: H0: μ ≤ 37.9 HA: μ > 37.9 A sample of 31...
 Consider the following hypotheses:
H0: μ ≤ 37.9
HA: μ > 37.9
A sample of 31 observations yields a sample mean of 39.3. Assume
that the sample is drawn from a normal population with a population
standard deviation of 4.2. Tables provided below z table
or t table****
a-1. Find the p-value.
0.05 p-value < 0.10
p-value 0.10
p-value < 0.01
0.01 p-value < 0.025
0.025 p-value < 0.05
a-2. What is the conclusion if α =
0.01?
Reject H0 since the p-value is...
Consider the following hypotheses:
H0: μ ≤ 37.9
HA: μ > 37.9
A sample of 31 observations yields a sample mean of 39.3. Assume
that the sample is drawn from a normal population with a population
standard deviation of 4.2. Tables provided below z table
or t table****
a-1. Find the p-value.
0.05 p-value < 0.10
p-value 0.10
p-value < 0.01
0.01 p-value < 0.025
0.025 p-value < 0.05
a-2. What is the conclusion if α =
0.01?
Reject H0 since the p-value is...
 Normal distribution
The execution times in seconds of a certain experiment have a
normal distribution with a mean of 38 and a variance of 36.
a) What is the probability that an experiment test will last more
than 42 seconds?
b) If the test times located in the top 10% are classified as
reserved, what is the minimum time to be in this category?
c) What is the proportion of tests that have times that exceed at
least five seconds...
Normal distribution
The execution times in seconds of a certain experiment have a
normal distribution with a mean of 38 and a variance of 36.
a) What is the probability that an experiment test will last more
than 42 seconds?
b) If the test times located in the top 10% are classified as
reserved, what is the minimum time to be in this category?
c) What is the proportion of tests that have times that exceed at
least five seconds...
 Please give detailed explanation how you got answers.
Thank you in advance.
Z table is included. please show steps how to derive
to answer. Thank you, experts.
4. Find the following probabilities based on the standard normal variable Z. (You may find reference the z table. Round your answers to 4 decimal places.) 3.33 Doints 0.7881 0.0096 a. P(Z >08) b. PIZ-2.34) C. POSZ $ 1.57) d. P(-0.73SZ S2.81) eBook References MC Graw Hill < Prey Enfrey Next > Type...
Please give detailed explanation how you got answers.
Thank you in advance.
Z table is included. please show steps how to derive
to answer. Thank you, experts.
4. Find the following probabilities based on the standard normal variable Z. (You may find reference the z table. Round your answers to 4 decimal places.) 3.33 Doints 0.7881 0.0096 a. P(Z >08) b. PIZ-2.34) C. POSZ $ 1.57) d. P(-0.73SZ S2.81) eBook References MC Graw Hill < Prey Enfrey Next > Type...
 please explain
3.3) [8 pts] A sample of 29 randomly selected automobile owners were asked to keep a record of the kilometers they travel. The random sample showed an average of 28,350 kilometers and a standard deviation of 5,237 kilometers. Assuming the underlying population is normally distributed, test the hypothesis that automobiles are driven on average more than 28,000 kilometers per year at the 10% level. Hou = 28,000 Hu> 28,000 First, specify: "If {inequality} we fail to reject the...
please explain
3.3) [8 pts] A sample of 29 randomly selected automobile owners were asked to keep a record of the kilometers they travel. The random sample showed an average of 28,350 kilometers and a standard deviation of 5,237 kilometers. Assuming the underlying population is normally distributed, test the hypothesis that automobiles are driven on average more than 28,000 kilometers per year at the 10% level. Hou = 28,000 Hu> 28,000 First, specify: "If {inequality} we fail to reject the...
 Two questions
For each of the following questions: clearly indicate the probability distribution being used to solve the problem solve by hand, and verify your answer using MATLAB. 1. Two teams, A and B, play a series of games. If team B has a probability 0.4 of winning each game, is it to their advantage to play the best three out of five games or the best four out of seven, and why? Assume the outcomes of successive games are...
Two questions
For each of the following questions: clearly indicate the probability distribution being used to solve the problem solve by hand, and verify your answer using MATLAB. 1. Two teams, A and B, play a series of games. If team B has a probability 0.4 of winning each game, is it to their advantage to play the best three out of five games or the best four out of seven, and why? Assume the outcomes of successive games are...
 Use the sample data and confidence level given below to complete parts (a) through (d). A research institute poll asked respondents if they felt vulnerable to identity theft. In the poll, n=924 and x = 540 who said "yes." Use a 90% confidence level. E Click the icon to view a table of z scores. a) Find the best point estimate of the population proportion p (Round to three decimal places as needed.) b) Identify the value of the margin...
 Suppose that for a very large shipment of integrated circuit chips, the probability of failure for anyone chip is 0.20. Assuming that the assumptions underlying the binomial distributions are met find the probability that at most chips fail in a random sample of 18 Cick here to view page 1 of the table of binomial probably sums Cok here to view page 2 of the table of binomial probably sums The probability at most chips fails Round to four decimal...
 Al Claim: deviation = 8.2, Sample information! Variance-59.8 Sample size=55 Test the claim with 95% confidence TABLE 3 Cumulative Probability Cumulative Areas of the Standard Normal Distribution continued) The entries in this table are the cumulative probabilities for the standard standard deviation 1). The shaded area under the curve of the standard normal distribution represents the cumulative probability to the left of a to s-value in the left-hand tail. 1 0.02 00 01 02 03 04 18 0.00 0.01 0.03...
 8.4.22 :3 Question Help The heights of 1000 students are approximately normally distributed with a mean of 177.7 centimeters and a standard deviation of 7.2 centimeters. Suppose 200 random samples of size 25 are drawn from this population and the means recorded to the nearest tenth of a centimeter. Complete parts (a) through (c) below. Click here to view page 1 of the standard normal distribution table. Click here to view page 2 of the standard normal distribution table. 0...
 these two questions im having trouble on. Provides the tables
for both
M 6.2.75 се Use a standard normal distribution table to obtain the Z-score that has an area of 0.975 to its right. Click here to view page 1 of the normal distribution table, As Click here to view page 2 of the normal distribution table. Za St (Round to two decimal places as needed.) normal distribution page 1 Areas under the standard normal curve Second decimal place in...
these two questions im having trouble on. Provides the tables
for both
M 6.2.75 се Use a standard normal distribution table to obtain the Z-score that has an area of 0.975 to its right. Click here to view page 1 of the normal distribution table, As Click here to view page 2 of the normal distribution table. Za St (Round to two decimal places as needed.) normal distribution page 1 Areas under the standard normal curve Second decimal place in...
 Consider the following hypotheses:
H0: μ ≤ 37.9
HA: μ > 37.9
A sample of 31 observations yields a sample mean of 39.3. Assume
that the sample is drawn from a normal population with a population
standard deviation of 4.2. Tables provided below z table
or t table****
a-1. Find the p-value.
0.05 p-value < 0.10
p-value 0.10
p-value < 0.01
0.01 p-value < 0.025
0.025 p-value < 0.05
a-2. What is the conclusion if α =
0.01?
Reject H0 since the p-value is...
Consider the following hypotheses:
H0: μ ≤ 37.9
HA: μ > 37.9
A sample of 31 observations yields a sample mean of 39.3. Assume
that the sample is drawn from a normal population with a population
standard deviation of 4.2. Tables provided below z table
or t table****
a-1. Find the p-value.
0.05 p-value < 0.10
p-value 0.10
p-value < 0.01
0.01 p-value < 0.025
0.025 p-value < 0.05
a-2. What is the conclusion if α =
0.01?
Reject H0 since the p-value is...
Most questions answered within 3 hours.
-
3) What are the typical social structures in a global city?
asked 21 minutes ago -
Luther Corporation
Consolidated Balance Sheet
December 31, 2019 and 2018 (in $ millions)
Assets
2019
2018...
asked 23 minutes ago -
(Expected rate of return and risk) Carter Inc. is evaluating a
security. Calculate the investment’s expected...
asked 3 hours ago -
What specific indicators can point to lack of progress for
African Americans in American society?
asked 4 hours ago -
1-The Electrons in a beam are moving at 2.7×10⁸ m/s in an
electric field of 15000...
asked 4 hours ago -
A gas tank is a vertical cylinder. It has a radius of 1m, a
height of...
asked 4 hours ago -
Accent Software faces the following conditions. All of these
support Accent’s use of a market-penetration pricing...
asked 5 hours ago -
A mathematically inclined friend emails you the following
instructions: "Meet me in the cafeteria the first...
asked 5 hours ago -
A monopoly sells in two countries . The demand curves in the two
countries are p1...
asked 6 hours ago -
A .15kg rubber ball is bounced off a wall. Before hitting the
wall, the ball moves...
asked 7 hours ago -
A manufacturing company preparing to build a new plant is
considering three potential locations for it....
asked 7 hours ago -
B. If compound Y has approximately the same values of solubility
in toluene as compound X,...
asked 8 hours ago