


Homework Answers

= 8.946
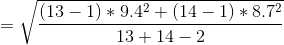
Option-5) If Sp = 8.946, then t 
df = 35
Add Answer to:
Question We are doing a two-mean pooled t-test. We have two samples with sizes n =...
please solve the example As with the confidence intervals, we will be assuming the two population...
 please solve the example
As with the confidence intervals, we will be assuming the two population standard deviations are equa but unknown. Thus, we will need to calculate the pooled standard deviation to use in our test statistic. Dur typical hypothesis test would be of the form H:44-42 = 8vs. H:4,-4, 78This is a two side test because the alternative is not equal. (H:14-4, <8, or H:44 - H2>, are also possible. Our test statistic is I X - X₂-8...
please solve the example
As with the confidence intervals, we will be assuming the two population standard deviations are equa but unknown. Thus, we will need to calculate the pooled standard deviation to use in our test statistic. Dur typical hypothesis test would be of the form H:44-42 = 8vs. H:4,-4, 78This is a two side test because the alternative is not equal. (H:14-4, <8, or H:44 - H2>, are also possible. Our test statistic is I X - X₂-8...
Q2) Independent-Samples t-Test (15 points total) Help with H, I, J, K, L please! In a...
Q2) Independent-Samples t-Test (15 points total) Help with H, I, J, K, L please! In a research project, researchers collected demographic and health data from a sample of elderly residents in the community. To examine any possible gender differences in their sample, they want to see if the females and the males differ significantly on the education level (number of years of formal schooling). The researchers are not predicting any direction in the possible gender differences so the hypotheses should...
I do not know how make dot plots. I have the plots but do not know the code for R. Help me with t...
 I do not know how make dot plots. I have the plots but do not
know the code for R.
Help me with the code please
1. A dairy scientist is testing a new feed additive. She chooses 13 cows at random from a large population of cows. She randomly assigns mold 8 to get the old dict, and nnew-5 to get the new diet including the additive. The cows are housed in 13 separated pens and each gets separate...
I do not know how make dot plots. I have the plots but do not
know the code for R.
Help me with the code please
1. A dairy scientist is testing a new feed additive. She chooses 13 cows at random from a large population of cows. She randomly assigns mold 8 to get the old dict, and nnew-5 to get the new diet including the additive. The cows are housed in 13 separated pens and each gets separate...
a. The question that you are seeking to answer with the hypothesis test (e.g., Do we...
 a. The question that you are seeking to answer with the
hypothesis test (e.g., Do we have evidence to conclude that mean
spending has declined?)
b. The null and alternative hypotheses (in words as well as
using symbols)
c. The level of significance
d. The procedure to be used (e.g., Mean: population standard
deviation known)
e. Excel output (copy and paste from Excel into your
word-processed document)
f. The value of the test statistic
g. The critical value
h. The...
a. The question that you are seeking to answer with the
hypothesis test (e.g., Do we have evidence to conclude that mean
spending has declined?)
b. The null and alternative hypotheses (in words as well as
using symbols)
c. The level of significance
d. The procedure to be used (e.g., Mean: population standard
deviation known)
e. Excel output (copy and paste from Excel into your
word-processed document)
f. The value of the test statistic
g. The critical value
h. The...
10:15 GX 1.51%. e s o s IL Multiple choice (60 p cholesben 1. The shape...
 10:15 GX 1.51%. e s o s IL Multiple choice (60 p cholesben 1. The shape of the Men deviation 2. The standard Standard deviat i le devii d curve la tribal the value i n 15 3. Ir the were mad e is 2.5 or distribution is 45 and standard deviation of normal distributors is that the value of x for a distribution is 97.5 47.5 e 373 4 675 See other value. 4. Considering the normal distribution, pal...
Question Completion Status: QUESTION 2 The Null Hypothesis (HO): O The two categorical variables are independent...
 Question Completion Status: QUESTION 2 The Null Hypothesis (HO): O The two categorical variables are independent Op1 = P2 = ... = Pg, where g = 4 Homogeneity of distribution of a categorical response Goodness-of-fit test QUESTION 3 Significance level: a = a=0.05 Which test statistic would we use for the test? X-MO 2 = P - Po po(1-P) F = t= MSG MSE x-1 (0-1) E s/n (a) 72 (b) (c) (d) O 1.a O2.b O3.c 04.0 QUESTION 4...
What is the conclusion for t-test concerning if the mean child mortality rate for countries in...
 What is the conclusion for t-test concerning if the mean child
mortality rate for countries in Africa is more than the mean child
mortality rate for countries in South Asia?
Did i get the right answer?
1.
RYAN GREGURICH of 5 Step 1 of 1 Question 2- 00:16:35 What is the conclusion for t-test concerning if the mean child mortality rate for countrles in Afica is more than the mean child mortality rate for countries in South Asia? Answer 10...
What is the conclusion for t-test concerning if the mean child
mortality rate for countries in Africa is more than the mean child
mortality rate for countries in South Asia?
Did i get the right answer?
1.
RYAN GREGURICH of 5 Step 1 of 1 Question 2- 00:16:35 What is the conclusion for t-test concerning if the mean child mortality rate for countrles in Afica is more than the mean child mortality rate for countries in South Asia? Answer 10...
eBook Video Exercise 10.1 (Algorithmic)) Consider the following results for two independent random samples taken from...
 eBook Video Exercise 10.1 (Algorithmic)) Consider the following results for two independent random samples taken from two populations. Sample 1 Sample 2 n 50 n2 35 1-1=13.6 X2= 11.1 a. What is the point estimate of the difference between the two population means? | b. Provide a 90% confidence interval for the difference between the two population means (to 2 decimals). c Provide a 95% confidence interval for the difference between the two population means to 2 decimals eBook Video...
Need help with review. Please answer both questions. I really need help. This Question: 1 pt...
 Need help with review. Please answer both questions. I really
need help.
This Question: 1 pt 7 of 8 (6 complete) A sample mean, sample size, and sample standard deviation are provided below. Use the one-mean t-test to perform the required hypothesis test at the 1% significance level. - :28. s:8, n:32, Ho : μ=30. Ha-μ:30 Data Table Ell Click here to view a partial table of values of ta The test statistic ist- (Round to two decimal places as...
Need help with review. Please answer both questions. I really
need help.
This Question: 1 pt 7 of 8 (6 complete) A sample mean, sample size, and sample standard deviation are provided below. Use the one-mean t-test to perform the required hypothesis test at the 1% significance level. - :28. s:8, n:32, Ho : μ=30. Ha-μ:30 Data Table Ell Click here to view a partial table of values of ta The test statistic ist- (Round to two decimal places as...
please answer all questions and use the formula sheet below for question 23. 20) statistics students must be t ssume that we want to estimate the mean 10 score for the pogaoe that the sample mea...
 please answer all questions and use the formula sheet below
for question 23.
20) statistics students must be t ssume that we want to estimate the mean 10 score for the pogaoe that the sample mean is within statistics shudents. How many 95% confidence that the sample mean ts within andomly selected for 10 tests if we want 2 10 points of the population mean? Note that 10 tests are typicalls standard devintion is 15 error Ey? (a) Decrease ow...
please answer all questions and use the formula sheet below
for question 23.
20) statistics students must be t ssume that we want to estimate the mean 10 score for the pogaoe that the sample mean is within statistics shudents. How many 95% confidence that the sample mean ts within andomly selected for 10 tests if we want 2 10 points of the population mean? Note that 10 tests are typicalls standard devintion is 15 error Ey? (a) Decrease ow...
 please solve the example
As with the confidence intervals, we will be assuming the two population standard deviations are equa but unknown. Thus, we will need to calculate the pooled standard deviation to use in our test statistic. Dur typical hypothesis test would be of the form H:44-42 = 8vs. H:4,-4, 78This is a two side test because the alternative is not equal. (H:14-4, <8, or H:44 - H2>, are also possible. Our test statistic is I X - X₂-8...
please solve the example
As with the confidence intervals, we will be assuming the two population standard deviations are equa but unknown. Thus, we will need to calculate the pooled standard deviation to use in our test statistic. Dur typical hypothesis test would be of the form H:44-42 = 8vs. H:4,-4, 78This is a two side test because the alternative is not equal. (H:14-4, <8, or H:44 - H2>, are also possible. Our test statistic is I X - X₂-8...
 I do not know how make dot plots. I have the plots but do not
know the code for R.
Help me with the code please
1. A dairy scientist is testing a new feed additive. She chooses 13 cows at random from a large population of cows. She randomly assigns mold 8 to get the old dict, and nnew-5 to get the new diet including the additive. The cows are housed in 13 separated pens and each gets separate...
I do not know how make dot plots. I have the plots but do not
know the code for R.
Help me with the code please
1. A dairy scientist is testing a new feed additive. She chooses 13 cows at random from a large population of cows. She randomly assigns mold 8 to get the old dict, and nnew-5 to get the new diet including the additive. The cows are housed in 13 separated pens and each gets separate...
 a. The question that you are seeking to answer with the
hypothesis test (e.g., Do we have evidence to conclude that mean
spending has declined?)
b. The null and alternative hypotheses (in words as well as
using symbols)
c. The level of significance
d. The procedure to be used (e.g., Mean: population standard
deviation known)
e. Excel output (copy and paste from Excel into your
word-processed document)
f. The value of the test statistic
g. The critical value
h. The...
a. The question that you are seeking to answer with the
hypothesis test (e.g., Do we have evidence to conclude that mean
spending has declined?)
b. The null and alternative hypotheses (in words as well as
using symbols)
c. The level of significance
d. The procedure to be used (e.g., Mean: population standard
deviation known)
e. Excel output (copy and paste from Excel into your
word-processed document)
f. The value of the test statistic
g. The critical value
h. The...
 10:15 GX 1.51%. e s o s IL Multiple choice (60 p cholesben 1. The shape of the Men deviation 2. The standard Standard deviat i le devii d curve la tribal the value i n 15 3. Ir the were mad e is 2.5 or distribution is 45 and standard deviation of normal distributors is that the value of x for a distribution is 97.5 47.5 e 373 4 675 See other value. 4. Considering the normal distribution, pal...
 Question Completion Status: QUESTION 2 The Null Hypothesis (HO): O The two categorical variables are independent Op1 = P2 = ... = Pg, where g = 4 Homogeneity of distribution of a categorical response Goodness-of-fit test QUESTION 3 Significance level: a = a=0.05 Which test statistic would we use for the test? X-MO 2 = P - Po po(1-P) F = t= MSG MSE x-1 (0-1) E s/n (a) 72 (b) (c) (d) O 1.a O2.b O3.c 04.0 QUESTION 4...
 What is the conclusion for t-test concerning if the mean child
mortality rate for countries in Africa is more than the mean child
mortality rate for countries in South Asia?
Did i get the right answer?
1.
RYAN GREGURICH of 5 Step 1 of 1 Question 2- 00:16:35 What is the conclusion for t-test concerning if the mean child mortality rate for countrles in Afica is more than the mean child mortality rate for countries in South Asia? Answer 10...
What is the conclusion for t-test concerning if the mean child
mortality rate for countries in Africa is more than the mean child
mortality rate for countries in South Asia?
Did i get the right answer?
1.
RYAN GREGURICH of 5 Step 1 of 1 Question 2- 00:16:35 What is the conclusion for t-test concerning if the mean child mortality rate for countrles in Afica is more than the mean child mortality rate for countries in South Asia? Answer 10...
 eBook Video Exercise 10.1 (Algorithmic)) Consider the following results for two independent random samples taken from two populations. Sample 1 Sample 2 n 50 n2 35 1-1=13.6 X2= 11.1 a. What is the point estimate of the difference between the two population means? | b. Provide a 90% confidence interval for the difference between the two population means (to 2 decimals). c Provide a 95% confidence interval for the difference between the two population means to 2 decimals eBook Video...
 Need help with review. Please answer both questions. I really
need help.
This Question: 1 pt 7 of 8 (6 complete) A sample mean, sample size, and sample standard deviation are provided below. Use the one-mean t-test to perform the required hypothesis test at the 1% significance level. - :28. s:8, n:32, Ho : μ=30. Ha-μ:30 Data Table Ell Click here to view a partial table of values of ta The test statistic ist- (Round to two decimal places as...
Need help with review. Please answer both questions. I really
need help.
This Question: 1 pt 7 of 8 (6 complete) A sample mean, sample size, and sample standard deviation are provided below. Use the one-mean t-test to perform the required hypothesis test at the 1% significance level. - :28. s:8, n:32, Ho : μ=30. Ha-μ:30 Data Table Ell Click here to view a partial table of values of ta The test statistic ist- (Round to two decimal places as...
 please answer all questions and use the formula sheet below
for question 23.
20) statistics students must be t ssume that we want to estimate the mean 10 score for the pogaoe that the sample mean is within statistics shudents. How many 95% confidence that the sample mean ts within andomly selected for 10 tests if we want 2 10 points of the population mean? Note that 10 tests are typicalls standard devintion is 15 error Ey? (a) Decrease ow...
please answer all questions and use the formula sheet below
for question 23.
20) statistics students must be t ssume that we want to estimate the mean 10 score for the pogaoe that the sample mean is within statistics shudents. How many 95% confidence that the sample mean ts within andomly selected for 10 tests if we want 2 10 points of the population mean? Note that 10 tests are typicalls standard devintion is 15 error Ey? (a) Decrease ow...
Most questions answered within 3 hours.
-
I asked a question similar to this one, which was answered
perfectly. Another practice problem is...
asked 1 minute ago -
Railco sells to its customers on account with terms of 2% / 5
/net 15. Ronco...
asked 6 minutes ago -
Refer to the following lease amortization schedule. The 10
payments are made annually starting with the...
asked 20 minutes ago -
Explain how God fits into Aquinas' theory of happiness.
asked 28 minutes ago -
1.1 With aid of diagrams and suitable examples discuss
the economic effects of price controls.
1.2...
asked 33 minutes ago -
When the nuclide polonium-214 undergoes alpha
decay:
The name of the product nuclide is .
The...
asked 47 minutes ago -
Q. The market demand function is D(Pd) = 160 - 2Pd and the
market supply function...
asked 52 minutes ago -
An unknown alcohol is analyzed by freezing point depression. The
unknown is either methanol (CH3OH), ethanol...
asked 53 minutes ago -
As a person inhales, air moves down the windpipe (bronchus),
through a constriction where the air...
asked 55 minutes ago -
Youngchang Keyboard sells a $1400 keyboard on a monthly payment
plan over 2 years.
a) If...
asked 1 hour ago -
For a one step reaction, the activation energy for the
forward reaction is 40.0 kJ mol-1,...
asked 1 hour ago -
1. A good thesis statement _____ .
is limited but not too narrow
is very broad...
asked 1 hour ago