
Homework Answers
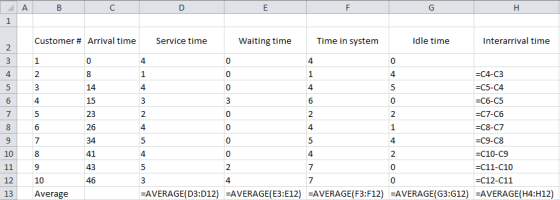
| Customer # | Arrival time | Service time | Waiting time | Time in system | Idle time | Interarrival time |
| 1 | 0 | 4 | 0 | 4 | 0 | |
| 2 | 8 | 1 | 0 | 1 | 4 | 8 |
| 3 | 14 | 4 | 0 | 4 | 5 | 6 |
| 4 | 15 | 3 | 3 | 6 | 0 | 1 |
| 5 | 23 | 2 | 0 | 2 | 2 | 8 |
| 6 | 26 | 4 | 0 | 4 | 1 | 3 |
| 7 | 34 | 5 | 0 | 5 | 4 | 8 |
| 8 | 41 | 4 | 0 | 4 | 2 | 7 |
| 9 | 43 | 5 | 2 | 7 | 0 | 2 |
| 10 | 46 | 3 | 4 | 7 | 0 | 3 |
| Average | 3.5 | 0.9 | 4.4 | 1.8 | 5.11 |
(i) Average waiting time = 0.90 minutes
(ii) Prob(customers waiting) = 3/10 = 30%
(iii) Prob(idle server) = total idle time / total run time = (1.8*10) / 46 = 0.39
(iv) Average service time = 3.5 minutes
(v) Average time between arrivals = 5.11 minutes
(v) Average time in the system = 4.4 minutes
Computations:
Add Answer to:
Problem 1 Given the data below for a single-server single-queue system, find the following performance measures....
**LOOKING FOR FORMULAS, ANSWERS PROVIDED. Problem-1: At a single-phase, multiple-channel service facility, customers arrive randomly. Statistical...
**LOOKING FOR FORMULAS, ANSWERS PROVIDED. Problem-1: At a single-phase, multiple-channel service facility, customers arrive randomly. Statistical analysis of past data shows that the interarrival time has a mean of 20 minutes and a standard deviation of 4 minutes. The service time per customer has a mean of 15 minutes and a standard deviation of 5 minutes. The waiting cost is $200 per customer per hour. The server cost is $25 per server per hour. Assume general probability distribution and no...
For the following problems compute (a) utilization, (b) average time a customer waits in the queue,...
For the following problems compute (a) utilization, (b) average time a customer waits in the queue, (c) average number of customers waiting in the queue, (d) average number of customers in service, (e) the average time a customer spends in the system. Problem 1. An average of 10 cars per hour (with variance 4) arrives at a single-server drive-in teller. Assume that the average service time for each customer is 5.5 minutes (with variance 5). Problem 2. Customers arrive to...
3. For a single-server, single-line, single-phase waiting line system, where l represents the mean arrival rate...
3. For a single-server, single-line, single-phase waiting line system, where l represents the mean arrival rate of customers and m represents the mean service rate, what is the formula for the average utilization of the system? a) l / m b) l / (m-l) c) l2 / m(m-l) d) 1 / (m-l) e) l / m(m-l) 4. For a single-server, single-line, single-phase waiting line system, where l represents the mean arrival rate of customers and m represents the mean service...
Please fill in all question marks!!!! Problem 15-25 (Algorithmic) Burger Dome sells hamburgers, cheeseburgers, French fries,...
Please fill in all question marks!!!! Problem 15-25 (Algorithmic) Burger Dome sells hamburgers, cheeseburgers, French fries, soft drinks, and milk shakes, as well as a limited number of specialty items and dessert selections. Although Burger Dome would like to serve each customer immediately, at times more customers arrive than can be handled by the Burger Dome food service staff. Thus, customers wait in line to place and receive their orders. Suppose that Burger Dome analyzed data on customer arrivals and...
Consider a single-server queueing system with arrival and service details as: Interarrival times: 3, 2, 6,...
Consider a single-server queueing system with arrival and service details as: Interarrival times: 3, 2, 6, 2, 4, 5 Service times: 2, 5, 5, 8, 4, 5 Prepare a table show below for the given data. Stop simulation when the clock reaches 20. Write a Java program, to implement this single-server queueing system, print out the table shown below: You should create a future event list in your Java code, and print out the contents of FE list in each...
After completing the data missing in this table: (A) Compute mean length of the queue of...
 After completing the data missing in this table:
(A) Compute mean length of the queue of the system. (Hint: try
using a statistical accumulator)
(B) Make an educated guess of the impact to the system if the
following was changed:
o Parts arrived more quickly
o Service time decreased
Time Idle time of Customer Inter arrival time Arrival time Serivice time Time service Waiting time Time service customer the system ends n queue (min) (min) (min) begin (min) spends in...
After completing the data missing in this table:
(A) Compute mean length of the queue of the system. (Hint: try
using a statistical accumulator)
(B) Make an educated guess of the impact to the system if the
following was changed:
o Parts arrived more quickly
o Service time decreased
Time Idle time of Customer Inter arrival time Arrival time Serivice time Time service Waiting time Time service customer the system ends n queue (min) (min) (min) begin (min) spends in...
Question 1 Simulate the operation of a first-in-first-out queuing system until time TE = 30 minutes,...
Question 1 Simulate the operation of a first-in-first-out queuing system until time TE = 30 minutes, using the interarrival and service-times given below (in minutes) in the given order. Interarrival times: 4, 3, 1, 1, 5, 7, 10 Service times: 4, 4, 6, 9, 8, 7, 4, 6 Given that the first arrival occurs at time t = 0, create a record of hand simulation (on the table given in the last page) using the event-scheduling algorithm and compute the...
In a single queue with random arrivals 60 an hour and random service times average 80...
In a single queue with random arrivals 60 an hour and random service times average 80 per hour. Find: (a) the average number of customers in the waiting line; (b) the average number of customers in the service system; (c) the average waiting time in line; (d) the average time spent in the system
For an infinite-source, single server system with an arrival rate of 15 customers per hour (Poisson)...
For an infinite-source, single server system with an arrival rate of 15 customers per hour (Poisson) and service time of 2 minutes per customer (exponential), the average number waiting in line to be served is: a. 0.1 b. 0.133 c. 0.50 d.0.250
Problem 1 REGIONAL AIRLINES Regional Airlines is establishing a new telephone system for handling flight reservations....
 Problem 1 REGIONAL AIRLINES Regional Airlines is establishing a new telephone system for handling flight reservations. During the 10:00 A.M. to 11:00 A.M. time period, calls to the reservation agent occur ran- domly at an average of one call every 3.75 minutes. Historical service time data show that a reservation agent spends an average of 3 minutes with each customer. The waiting line model assumptions of Poisson arrivals and exponential service times appear reasonable for the telephone reservation system. Regional...
 After completing the data missing in this table:
(A) Compute mean length of the queue of the system. (Hint: try
using a statistical accumulator)
(B) Make an educated guess of the impact to the system if the
following was changed:
o Parts arrived more quickly
o Service time decreased
Time Idle time of Customer Inter arrival time Arrival time Serivice time Time service Waiting time Time service customer the system ends n queue (min) (min) (min) begin (min) spends in...
After completing the data missing in this table:
(A) Compute mean length of the queue of the system. (Hint: try
using a statistical accumulator)
(B) Make an educated guess of the impact to the system if the
following was changed:
o Parts arrived more quickly
o Service time decreased
Time Idle time of Customer Inter arrival time Arrival time Serivice time Time service Waiting time Time service customer the system ends n queue (min) (min) (min) begin (min) spends in...
 Problem 1 REGIONAL AIRLINES Regional Airlines is establishing a new telephone system for handling flight reservations. During the 10:00 A.M. to 11:00 A.M. time period, calls to the reservation agent occur ran- domly at an average of one call every 3.75 minutes. Historical service time data show that a reservation agent spends an average of 3 minutes with each customer. The waiting line model assumptions of Poisson arrivals and exponential service times appear reasonable for the telephone reservation system. Regional...
Most questions answered within 3 hours.
-
han discusses the racist practice of badlands, a bar
in the Castro
district of San Francisco,...
asked 5 minutes ago -
A sample of final exam scores is normally distributed with a
mean equal to 25 and...
asked 9 minutes ago -
An investor shorts 100 shares of a stock when the share price is
$50 and closes...
asked 13 minutes ago -
LLOP corporation just paid 4$ dividend per share, you expect the
dividend to grow 8% for...
asked 22 minutes ago -
if we subtract 1000 from 0001 is there overflow? (binary)
asked 30 minutes ago -
Hello, I need help with the function below, The language I am
using is Ocaml
open...
asked 31 minutes ago -
Explain how the presence of glucose represses the gal structural
genes?
asked 39 minutes ago -
For the reaction CaI2+2AgNO3⟶2AgI+Ca(NO3)2 how many grams of
silver iodide, AgI, are produced from 56.5 g...
asked 51 minutes ago -
Write an equation for hydrolysis via acid catalysis.
Using ethyl acetate, ethyl benzoate, ethyl formate or...
asked 58 minutes ago -
Only one graph is needed.
(a) Draw a Supply Curve and the Demand Curve for the...
asked 1 hour ago -
Fill in the blanks and please show how you arrived at numerical
answers
. The...
asked 1 hour ago -
91. If the half – life of a sample of radioactive
material is 60 days, what...
asked 1 hour ago