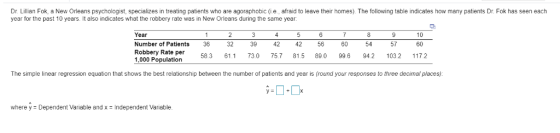
a) The simple linear regression equation that shows the best relationship between the number of patients and year is (round your responses to three decimal places).
y= _ + _x
b) Using linear regression the number of patients Dr. Fok will see in year 11 = _____ patients (round your response to two decimal places).
c) Using linear regression, the number of patients Dr. Fok will see in year 12 = _____ patients. (round your response to two decimal places).
Homework Answers
a) Simple linear regression equation is determined using least square method as follows:

y = 30 + 3.236*x
------------
b) For year 11, x = 11, Number of patients Dr. Fok will see y = 30 + 3.236*11 = 65.60 patients
------------
c) For year 12, x = 12, Number of patients Dr. Fok will see y = 30 + 3.236*12 = 68.83 patients
Add Answer to:
a) The simple linear regression equation that shows the best
relationship between the number of patients...
Dr. Lillian folk in New Orleans psychologist specializes in treating patients who are agoraphobic afraid to...
 Dr.
Lillian folk in New Orleans psychologist specializes in treating
patients who are agoraphobic afraid to leave their homes the
following table indicates how many patients Dr. Faulk has seen each
year for the past 10 years it also indicates what the robbery rate
was in New Orleans during the same year the simple linear
regression equation that shows the best relationship between the
number of patients and year is?
Homework: Chapter 4 MHomework 42 41 58 39 S3 Robbery...
Dr.
Lillian folk in New Orleans psychologist specializes in treating
patients who are agoraphobic afraid to leave their homes the
following table indicates how many patients Dr. Faulk has seen each
year for the past 10 years it also indicates what the robbery rate
was in New Orleans during the same year the simple linear
regression equation that shows the best relationship between the
number of patients and year is?
Homework: Chapter 4 MHomework 42 41 58 39 S3 Robbery...
7 of 14 (4 complete) HW Score: 26.67%, 4 of 15 pts b Operat Score: 0...
 7 of 14 (4 complete) HW Score: 26.67%, 4 of 15 pts b Operat Score: 0 of 1 pt My Cour Problem 4.30 Question Help Course Dr. Lillian Fok, a New Orleans psychologist, specializes in treating patients who are agoraphobice, afraid to leave their homes). The following table indicates how many patients Dr. Fok has seen each year for the past 10 years. It also indicates what the robbery rate was in New Orleans during the same year Purchase 1...
omework: Ch 04 HW 2 ore: 0 of 20 pts roblem 4.39 Or. Lillian Fok, 4...
 omework: Ch 04 HW 2 ore: 0 of 20 pts roblem 4.39 Or. Lillian Fok, 4 of 6 (4 complete) ▼ HW Score: 30%, 3 Question l how many patients a New Orleans psychologist, specializes in treating patients who are agoraphobic (i.e, afraid to leave their homes). The following table indicates has seen each year for the past 10 years. It also indicates what the robbery rate was in New Orleans during the s ame year Year Number of Patients...
a l who are pro u d to leave their homes). The following late indicates how...
 a l who are pro u d to leave their homes). The following late indicates how many part Dr. Fokhas on h er for the past 10 years t o Dr. Lulan Fok, a New Orleans Peychelogi, species in re what the robbery rate was in New Orleans during the same year indicates Number of Patients 37 40 42 44 46 014 734 757 158 0 56 57 15 03256 0 0 Themen t ion that shows the best on...
Suppose that a simple linear regression model is appropriate for describing the relationship between y =...
Suppose that a simple linear regression model is appropriate for describing the relationship between y = house price and x = house size (sq ft) for houses in a large city. The true regression line is y = 22,500 + 46x and σ = 5000. (a) What is the average change in price associated with one extra sq ft of space? With an additional 100 sq ft of space? (b) What proportion of 2000 sq ft homes would be priced...
Suppose that a simple linear regression model is appropriate for describing the relationship between y =...
Suppose that a simple linear regression model is appropriate for describing the relationship between y = house price (in dollars) and x = house size (in sq. ft.) for houses in a large city. The population regression line is y = 22,500 + 48x and σ = 4,000. a) What is the average change in price associated with one extra sq. ft. of space? $ What is the average change in price associated with an additional 100 sq. ft. of...
Simple Linear regression 1. A researcher uses a simple linear regression to measure the relationship between...
 Simple Linear regression
1. A researcher uses a simple linear regression to measure the relationship between the monthly salary (Salary measured in dollars) of data scientists and the number of years since being awarded a Master degree (Master Degree). A random sample of 80 observations was collected for the analysis. A researcher used the econometric model which has the following specification Salary,-β0 + β, Master-Degree, + εί, where i = 1, , 80 The (incomplete) Excel output of equation (1)...
Simple Linear regression
1. A researcher uses a simple linear regression to measure the relationship between the monthly salary (Salary measured in dollars) of data scientists and the number of years since being awarded a Master degree (Master Degree). A random sample of 80 observations was collected for the analysis. A researcher used the econometric model which has the following specification Salary,-β0 + β, Master-Degree, + εί, where i = 1, , 80 The (incomplete) Excel output of equation (1)...
2. In a typical simple linear regression model, explore the relationship between the expected value of change in the re...
 2. In a typical simple linear regression model, explore the relationship between the expected value of change in the response variable y and the value of the regressor x changed by 20 or 40 units. Describe the condition or assumption, if any, to meet for such exploration. 3. In a multiple linear regression model where x1 and x2 are two regressors. Explore the relationship between the expected value of change in the response variable y and the value of the...
A psychologist wants to determine if there is a linear relationship between the number of hours...
A psychologist wants to determine if there is a linear relationship between the number of hours a person goes without sleep and the number of mistakes he/she makes on a simple test. The following data is recorded. Determine the equation of the regression line and graph the line on a scatter plot. Hours without Sleep, x Number of Mistakes, y x y 32 6 38 8 48 13 24 5 46 7 35 6 30 5 34 8 42 12...
Psychologist wants to determine if there is a linear relationship between the number of hours a...
Psychologist wants to determine if there is a linear relationship between the number of hours a person goes without sleep and the number of mistakes he/she makes on a simple test. The following data is recorded. Hours without sleep 32 38 48 24 46 35 30 34 42 Number of Mistakes 6 8 13 5 7 6 5 8 12 Hours without sleep=x, Number of mistakes=y 1. Find the equation of regression line. Round slope and y-intercept to nearest thousandth. ...
 Dr.
Lillian folk in New Orleans psychologist specializes in treating
patients who are agoraphobic afraid to leave their homes the
following table indicates how many patients Dr. Faulk has seen each
year for the past 10 years it also indicates what the robbery rate
was in New Orleans during the same year the simple linear
regression equation that shows the best relationship between the
number of patients and year is?
Homework: Chapter 4 MHomework 42 41 58 39 S3 Robbery...
Dr.
Lillian folk in New Orleans psychologist specializes in treating
patients who are agoraphobic afraid to leave their homes the
following table indicates how many patients Dr. Faulk has seen each
year for the past 10 years it also indicates what the robbery rate
was in New Orleans during the same year the simple linear
regression equation that shows the best relationship between the
number of patients and year is?
Homework: Chapter 4 MHomework 42 41 58 39 S3 Robbery...
 7 of 14 (4 complete) HW Score: 26.67%, 4 of 15 pts b Operat Score: 0 of 1 pt My Cour Problem 4.30 Question Help Course Dr. Lillian Fok, a New Orleans psychologist, specializes in treating patients who are agoraphobice, afraid to leave their homes). The following table indicates how many patients Dr. Fok has seen each year for the past 10 years. It also indicates what the robbery rate was in New Orleans during the same year Purchase 1...
 omework: Ch 04 HW 2 ore: 0 of 20 pts roblem 4.39 Or. Lillian Fok, 4 of 6 (4 complete) ▼ HW Score: 30%, 3 Question l how many patients a New Orleans psychologist, specializes in treating patients who are agoraphobic (i.e, afraid to leave their homes). The following table indicates has seen each year for the past 10 years. It also indicates what the robbery rate was in New Orleans during the s ame year Year Number of Patients...
 a l who are pro u d to leave their homes). The following late indicates how many part Dr. Fokhas on h er for the past 10 years t o Dr. Lulan Fok, a New Orleans Peychelogi, species in re what the robbery rate was in New Orleans during the same year indicates Number of Patients 37 40 42 44 46 014 734 757 158 0 56 57 15 03256 0 0 Themen t ion that shows the best on...
 Simple Linear regression
1. A researcher uses a simple linear regression to measure the relationship between the monthly salary (Salary measured in dollars) of data scientists and the number of years since being awarded a Master degree (Master Degree). A random sample of 80 observations was collected for the analysis. A researcher used the econometric model which has the following specification Salary,-β0 + β, Master-Degree, + εί, where i = 1, , 80 The (incomplete) Excel output of equation (1)...
Simple Linear regression
1. A researcher uses a simple linear regression to measure the relationship between the monthly salary (Salary measured in dollars) of data scientists and the number of years since being awarded a Master degree (Master Degree). A random sample of 80 observations was collected for the analysis. A researcher used the econometric model which has the following specification Salary,-β0 + β, Master-Degree, + εί, where i = 1, , 80 The (incomplete) Excel output of equation (1)...
 2. In a typical simple linear regression model, explore the relationship between the expected value of change in the response variable y and the value of the regressor x changed by 20 or 40 units. Describe the condition or assumption, if any, to meet for such exploration. 3. In a multiple linear regression model where x1 and x2 are two regressors. Explore the relationship between the expected value of change in the response variable y and the value of the...
Most questions answered within 3 hours.
-
3) What are the typical social structures in a global city?
asked 53 minutes ago -
Luther Corporation
Consolidated Balance Sheet
December 31, 2019 and 2018 (in $ millions)
Assets
2019
2018...
asked 55 minutes ago -
(Expected rate of return and risk) Carter Inc. is evaluating a
security. Calculate the investment’s expected...
asked 3 hours ago -
What specific indicators can point to lack of progress for
African Americans in American society?
asked 4 hours ago -
1-The Electrons in a beam are moving at 2.7×10⁸ m/s in an
electric field of 15000...
asked 4 hours ago -
A gas tank is a vertical cylinder. It has a radius of 1m, a
height of...
asked 5 hours ago -
Accent Software faces the following conditions. All of these
support Accent’s use of a market-penetration pricing...
asked 6 hours ago -
A mathematically inclined friend emails you the following
instructions: "Meet me in the cafeteria the first...
asked 6 hours ago -
A monopoly sells in two countries . The demand curves in the two
countries are p1...
asked 7 hours ago -
A .15kg rubber ball is bounced off a wall. Before hitting the
wall, the ball moves...
asked 7 hours ago -
A manufacturing company preparing to build a new plant is
considering three potential locations for it....
asked 7 hours ago -
B. If compound Y has approximately the same values of solubility
in toluene as compound X,...
asked 8 hours ago