I have a function f(x) whose range is the interval [0, 1], and I need to...
I have a function f(x) whose range is the interval [0, 1], and I need to shift it and stretch it so that the range is now the interval [a, b]. Find a function g(x) (defined in terms of f(x)) so that g(x) has an range [a, b].
In Matlab, the rand command produces a random number between 0 and 1, under the uniform distribution; that's different from the normal distribution. The graph of the uniform probability distribution is a horizontal line. The graph of the normal distribution is the bell curve.
I need a program that will accept input values a and b, a < b, and will output a random number between a and b, You'll do this by shifting and stretching the rand function. Notice that in Matlab the rand function doesn't take an input. You just type rand and hit enter, and the program will spit out a random number between 0 and 1.
Homework Answers
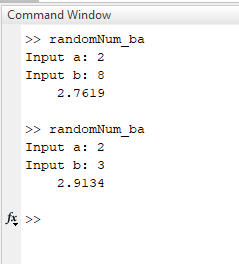
a=input('Input a: ');
b=input('Input b: ');
%rand() produces from 0 to 1
%we need it to produce values from a to b, or in the range of
(b-a)
%if we multiply it with (b-a), then it will produce in the range 0
to (b-a)
%if we then add a to it, the range becomes (0+a) to (b-a)+a
% which becomes a to b, which is what required
%hence is we want rand() to produce a number from a to b, and we
denote
%f(x) as rand,
%then g(x) = (b-a)*f(x) + a
randomNumber = a + rand()*(b-a);
disp(randomNumber)
Add Answer to:
I have a function f(x) whose range is the interval [0, 1], and I
need to...
Assume f is a function whose domain is the interval (-3,3, whose range is the interval...
 Assume f is a function whose domain is the interval (-3,3, whose range is the interval (-4,4), and whose graph is the figure below. 4 3 ܝ Let g be given by 8(x) = 2 - (1 - 1). 13pts/(a) Find the domain of g. 13pts/(b) Find the range of g. [4pts/(c) Sketch the graph of g.
i need Matlab code asap Write a program that evaluates the function f(x) = tan’x +...
 i need Matlab code asap
Write a program that evaluates the function f(x) = tan’x + x - 2 between -27 and 27 in steps of 1/10 and plots the results. Create a function handle for your function, and use function feval to evaluate your function at the specified points. 2. Write a program that locates the zeros of the function f(x) = cos éx -0.25 between 0 and 27. Use the function fzero to actually locate the zeros of...
i need Matlab code asap
Write a program that evaluates the function f(x) = tan’x + x - 2 between -27 and 27 in steps of 1/10 and plots the results. Create a function handle for your function, and use function feval to evaluate your function at the specified points. 2. Write a program that locates the zeros of the function f(x) = cos éx -0.25 between 0 and 27. Use the function fzero to actually locate the zeros of...
(1 point) The graph of the function f(z-log2(z-1) can be obtained from the graph of g(x)-log2...
 (1 point) The graph of the function f(z-log2(z-1) can be obtained from the graph of g(x)-log2 z by one of the following actions: (a) shifting the graph of g(x) to the right 1 units; (b) shifting the graph of g(x) to the left 1 units; (c) shifting the graph of g(x) upward 1 units; (d) shifting the graph of g(x) downward 1 units Your answer is (input a, b, c, or d) 23 The domain of the function f(z) is...
Instructions: If you require uniformly distributed random numbers in [0, 1], use Matlab’s built i...
 Instructions: If you require uniformly distributed random
numbers
in [0, 1], use Matlab’s built in uniform random number generator
rand. Also,
you may NOT use any Matlab built-in functions that explicitly
perform the task
asked for in the problem.
Problem 6. Let α > 0 and set f(x)- ae-ale, for x e(-oo, oo). (a) Make a plot of f (b) Show that f is a probability density function (Hint: -, when z S 0, and x-r, when 0.) (c) If...
Instructions: If you require uniformly distributed random
numbers
in [0, 1], use Matlab’s built in uniform random number generator
rand. Also,
you may NOT use any Matlab built-in functions that explicitly
perform the task
asked for in the problem.
Problem 6. Let α > 0 and set f(x)- ae-ale, for x e(-oo, oo). (a) Make a plot of f (b) Show that f is a probability density function (Hint: -, when z S 0, and x-r, when 0.) (c) If...
Problem 3 In this problem you add some random noise to the sine function and then...
Problem 3 In this problem you add some random noise to the sine function and then calculate the derivative. • First, generate a vector (the same length as x, above) which consists of random numbers in the range (-0.02) to (0.02). Use the MATLAB function rand. rand will return a random number between 0 and 1. For this problem, you actually need random numbers between +/- 0.02. How will you convert the random numbers you obtain from rand to be...
i need the code on matlab or octave for ploting this function in the interval [0,3]...
 i need the code on matlab or octave for ploting this function
in the interval [0,3]
i also need a copy of the graph
x2-2x + 1 f(x) = 2
i need the code on matlab or octave for ploting this function
in the interval [0,3]
i also need a copy of the graph
x2-2x + 1 f(x) = 2
Homework 4 - False Position Find the zeros of the function f(x) within the interval (-4,...
 Homework 4 - False Position Find the zeros of the function f(x) within the interval (-4, 6) using the False Position method with f(-4) > 0 what you must know before you start working on the homework: f(-1) <0 f(x) = sin(21(x/5) + exp(x/5) f(+6) > 0 (a) Write a Matlab function that computes the values for f(x) when xis given as an input. (b) Write a Matlab script entitled "myplot.m” that plots the functions f(x) within the interval (-4,...
(1 point) Find a formula for a function g(x) whose graph is obtained from f(x) by...
 (1 point) Find a formula for a function g(x) whose graph is obtained from f(x) by horizontally stretching by a factor of 7, reflecting across the z-axis, and shifting down 5 units. g(x) = |-7abs(x)-5
(Matlab) Suppose we have a function “hw5f.m” that takes as input x and outputs the value for a function f(x). Write a Matlab program that inputs: • interval [a, b]; • m, the number of data points wit...
 (Matlab) Suppose we have a function “hw5f.m” that takes as input
x and outputs the value for a function f(x). Write a Matlab program
that inputs: • interval [a, b]; • m, the number of data points with
evenly spaced nodes from x1 = a to xm = b, and values from f(x); •
location z satisfying x2 < z < xm−1, where h = (b − a)/(m −
1); and outputs the value of the interpolaton polynomial using only...
(Matlab) Suppose we have a function “hw5f.m” that takes as input
x and outputs the value for a function f(x). Write a Matlab program
that inputs: • interval [a, b]; • m, the number of data points with
evenly spaced nodes from x1 = a to xm = b, and values from f(x); •
location z satisfying x2 < z < xm−1, where h = (b − a)/(m −
1); and outputs the value of the interpolaton polynomial using only...
The function f has a domain of [0, 4 and a range of [0, 3]. Start by sketching a potential graph ...
 The function f has a domain of [0, 4 and a range of [0, 3]. Start by sketching a potential graph of f. a. Suppose the function g is defined as g(a) - f(r) +5. Determine the domain and range of g i. Domain: Preview no answer given ii. Range Enter an interval using interval notation [more..] 丼 revieW no answer given b. Suppose the function h is defined as h(x) - 3f(r). Determine the domain and range of h...
 Assume f is a function whose domain is the interval (-3,3, whose range is the interval (-4,4), and whose graph is the figure below. 4 3 ܝ Let g be given by 8(x) = 2 - (1 - 1). 13pts/(a) Find the domain of g. 13pts/(b) Find the range of g. [4pts/(c) Sketch the graph of g.
 i need Matlab code asap
Write a program that evaluates the function f(x) = tan’x + x - 2 between -27 and 27 in steps of 1/10 and plots the results. Create a function handle for your function, and use function feval to evaluate your function at the specified points. 2. Write a program that locates the zeros of the function f(x) = cos éx -0.25 between 0 and 27. Use the function fzero to actually locate the zeros of...
i need Matlab code asap
Write a program that evaluates the function f(x) = tan’x + x - 2 between -27 and 27 in steps of 1/10 and plots the results. Create a function handle for your function, and use function feval to evaluate your function at the specified points. 2. Write a program that locates the zeros of the function f(x) = cos éx -0.25 between 0 and 27. Use the function fzero to actually locate the zeros of...
 (1 point) The graph of the function f(z-log2(z-1) can be obtained from the graph of g(x)-log2 z by one of the following actions: (a) shifting the graph of g(x) to the right 1 units; (b) shifting the graph of g(x) to the left 1 units; (c) shifting the graph of g(x) upward 1 units; (d) shifting the graph of g(x) downward 1 units Your answer is (input a, b, c, or d) 23 The domain of the function f(z) is...
 Instructions: If you require uniformly distributed random
numbers
in [0, 1], use Matlab’s built in uniform random number generator
rand. Also,
you may NOT use any Matlab built-in functions that explicitly
perform the task
asked for in the problem.
Problem 6. Let α > 0 and set f(x)- ae-ale, for x e(-oo, oo). (a) Make a plot of f (b) Show that f is a probability density function (Hint: -, when z S 0, and x-r, when 0.) (c) If...
Instructions: If you require uniformly distributed random
numbers
in [0, 1], use Matlab’s built in uniform random number generator
rand. Also,
you may NOT use any Matlab built-in functions that explicitly
perform the task
asked for in the problem.
Problem 6. Let α > 0 and set f(x)- ae-ale, for x e(-oo, oo). (a) Make a plot of f (b) Show that f is a probability density function (Hint: -, when z S 0, and x-r, when 0.) (c) If...
 i need the code on matlab or octave for ploting this function
in the interval [0,3]
i also need a copy of the graph
x2-2x + 1 f(x) = 2
i need the code on matlab or octave for ploting this function
in the interval [0,3]
i also need a copy of the graph
x2-2x + 1 f(x) = 2
 Homework 4 - False Position Find the zeros of the function f(x) within the interval (-4, 6) using the False Position method with f(-4) > 0 what you must know before you start working on the homework: f(-1) <0 f(x) = sin(21(x/5) + exp(x/5) f(+6) > 0 (a) Write a Matlab function that computes the values for f(x) when xis given as an input. (b) Write a Matlab script entitled "myplot.m” that plots the functions f(x) within the interval (-4,...
 (1 point) Find a formula for a function g(x) whose graph is obtained from f(x) by horizontally stretching by a factor of 7, reflecting across the z-axis, and shifting down 5 units. g(x) = |-7abs(x)-5
 (Matlab) Suppose we have a function “hw5f.m” that takes as input
x and outputs the value for a function f(x). Write a Matlab program
that inputs: • interval [a, b]; • m, the number of data points with
evenly spaced nodes from x1 = a to xm = b, and values from f(x); •
location z satisfying x2 < z < xm−1, where h = (b − a)/(m −
1); and outputs the value of the interpolaton polynomial using only...
(Matlab) Suppose we have a function “hw5f.m” that takes as input
x and outputs the value for a function f(x). Write a Matlab program
that inputs: • interval [a, b]; • m, the number of data points with
evenly spaced nodes from x1 = a to xm = b, and values from f(x); •
location z satisfying x2 < z < xm−1, where h = (b − a)/(m −
1); and outputs the value of the interpolaton polynomial using only...
 The function f has a domain of [0, 4 and a range of [0, 3]. Start by sketching a potential graph of f. a. Suppose the function g is defined as g(a) - f(r) +5. Determine the domain and range of g i. Domain: Preview no answer given ii. Range Enter an interval using interval notation [more..] 丼 revieW no answer given b. Suppose the function h is defined as h(x) - 3f(r). Determine the domain and range of h...
Most questions answered within 3 hours.
-
Phosphorous + bromine = phosphorous tribromide. If 35.0 g of
bromine are reacted and 27.9 grams...
asked 1 hour ago -
Derive the long wavelength limit of the Planck energy density
distribution
asked 1 hour ago -
Calculate the pH of each of the following solutions.
0.50 M HBr
3.1×10⁻⁴ M KOH
4.2×10⁻⁵...
asked 4 hours ago -
For the year ended December 31, Depot Max’s cost of merchandise
sold was $85,600. Inventory at the...
asked 4 hours ago -
Week 10 - Professional Memo Assignment
Professional Memo Assignment
Your mission for this week, should you...
asked 4 hours ago -
Write a Python program that stores the data for each
player on the team, and it...
asked 4 hours ago -
In
the last 3 months, mike never knows when he is going to get his
allowance...
asked 5 hours ago -
Is Ca(OH)2 a Bronsted base, Lewis base, or both? Why?
asked 5 hours ago -
1A- Why don’t voters complain about U.S. tariffs on imported
sugar?
Because sugar is only a...
asked 5 hours ago -
Cash Payback Period
Primera Banco is evaluating two capital investment proposals for
a drive-up ATM kiosk,...
asked 5 hours ago -
Create a button in Swift (Xcode) that will create a charge,
create a charge using Stripe's...
asked 5 hours ago -
The reaction rate of CO and NO2 in the reaction
CO(g) + NO2(g) → CO2(g) +...
asked 5 hours ago