
Homework Answers


Add Answer to:
Find the regression equation, letting overhead width be the predictor (x) variable. Find the best predicted...
Find the regression equation, letting overhead width be the predictor (x) variable. Find the best predicted...
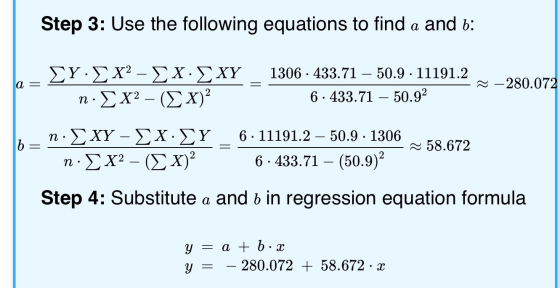
 Find the regression equation, letting overhead width be the predictor (x) variable. Find the best predicted weight of a seal if the overhead width measured from a photograph is 2.4 cm. Can the prediction be correct? What is wrong with predicting the weight in this case? Use a significance level of 0.05. Overhead Width (cm) 7.4 8.4 9.7 7.5 8.3 8.2 Weight (kg) 151 224 275 153 210 210 Click the icon to view the critical values of the Pearson...
Find the regression equation, letting overhead width be the predictor (x) variable. Find the best predicted...
Find the regression equation, letting overhead width be the predictor (x) variable. Find the best predicted weight of a seal if the overhead width measured from a photograph is 1.7 cm. Can the prediction be correct? What is wrong with predicting the weight in this case? Use a significance level of 0.05. Overhead Width (cm) 8.2 7.3 9.4 7.5 7.4 8.7 Weight (kg) 165 158 240 134 152 213 The regression equation is ModifyingAbove y with caretyequals=_____+______x. (Round to one...
Find the regression equation letting overhead with be the predictor(s) variable. Find the best predicted weight...
 Find the regression equation letting overhead with be the predictor(s) variable. Find the best predicted weight of a seal the overhead width moured from a photograph is 16 cm. Can the prediction be correct? What is wrong with predicting the weight in this case? Use a significance level of 0.05. Overhead Width (cm) 84 79 82 7.8 Weight (kg) 201 209 190 181 200 Click the loon to view the critical values of the Pearson correlation coeficient The regression equation...
n α=0.05 α=0.01 NOTE: To test H0: ρ=0 against H1: ρ≠0, reject H0 if the absolute...
 n
α=0.05
α=0.01
NOTE: To test
H0:
ρ=0
against
H1:
ρ≠0,
reject
H0
if the absolute value of r is greater than the critical value in
the table.
4
0.950
0.990
5
0.878
0.959
6
0.811
0.917
7
0.754
0.875
8
0.707
0.834
9
0.666
0.798
10
0.632
0.765
11
0.602
0.735
12
0.576
0.708
13
0.553
0.684
14
0.532
0.661
15
0.514
0.641
16
0.497
0.623
17
0.482
0.606
18
0.468
0.590
19
0.456
0.575
20
0.444
0.561
25...
n
α=0.05
α=0.01
NOTE: To test
H0:
ρ=0
against
H1:
ρ≠0,
reject
H0
if the absolute value of r is greater than the critical value in
the table.
4
0.950
0.990
5
0.878
0.959
6
0.811
0.917
7
0.754
0.875
8
0.707
0.834
9
0.666
0.798
10
0.632
0.765
11
0.602
0.735
12
0.576
0.708
13
0.553
0.684
14
0.532
0.661
15
0.514
0.641
16
0.497
0.623
17
0.482
0.606
18
0.468
0.590
19
0.456
0.575
20
0.444
0.561
25...
Find the regression equation, letting the diameter be the predictor (x) variable. Find the best predicted...
Find the regression equation, letting the diameter be the predictor (x) variable. Find the best predicted circumference of a beachball with a diameter of 44.6 cm. How does the result compare to the actual circumference of 140.1 cm? Use a significance level of 0.05. Find the regression equation, letting the diameter be the predictor (x) variable. Find the best predicted circumference of a beachball with a diameter of 44.6 cm. How does the result compare to the actual circumference of...
Find the regression equation, letting the diameter be the predictor (x) variable. Find the best predicted...
Find the regression equation, letting the diameter be the predictor (x) variable. Find the best predicted circumference of a marblemarble with a diameter of 1.7 cm. How does the result compare to the actual circumference of 5.3 cm? Use a significance level of 0.05 _ Diameter Circumference Baseball 7.4 23.2 Basketball 24.4 76.7 Golf 4.2 13.2 Soccer 21.9 68.8 Tennis 7.0 22.0 Ping-Pong 4.0 12.6 Volleyball 20.9 65.7 The regression equation is ModifyingAbove y with caretyequals=nothingplus+nothingx. (Round to five decimal...
Find the regression equation, letting the diameter be the predictor (x) variable. Find the best predicted...
 Find the regression equation, letting the diameter be the predictor (x) variable. Find the best predicted circumference of a marble with a diameter of 1.8 cm. How does the result compare to the actual circumference of 5.7 cm? Use a significance level of 0.05. Baseball Basketball Golf Soccer Tennis Ping-Pong Volleyball 7. 3 2 4.3 4.3 22.3 6.9 4.0 20.5 Circumference 22.9 76.3 13.5 70.1 21.7 12.6 64.4 Click the icon to view the critical values of the Pearson correlation...
Find the regression equation, letting the first variable be the predictor (x) variable. Using the listed...
 Find the regression equation, letting the first variable be the predictor (x) variable. Using the listed lemon/crash data, where lemon imports are in metric tons and the fatality rates are per 100,000 people, find the best predicted crash fatality rate for a year in which there are 475 metric tons of lemon imports. Is the prediction worthwhile? Lemon Imports 227 262 Crash Fatality Rate 16 15.8 364 15.4 496 15.4 523 15 Find the equation of the regression line ŷ=[]+()x...
Find the regression equation, letting the first variable be the predictor (x) variable. Find the best...
 Find the regression equation, letting the first variable be the predictor (x) variable. Find the best predicted Nobel Laureate rate for a country that has 78.3 Internet users per 100 people. How does it compare to the country's actual Nobel Laureate rate of 1.5 per 10 million people? Х i Data Table Click the icon to view the data. Find the equation of the regression line. ŷ=+x (Round the constant to one decimal place as needed. Round the coefficient to...
Find the regression equation, letting the first variable be the predictor (x) variable. Using the listed...
 Find the regression equation, letting the first variable be the predictor (x) variable. Using the listed lemon/crash data, where lemon imports are in metric tons and the fatality rates are per 100,000 people, find the best predicted crash fatality rate for a year in which there are 400 metric tons of lemon imports. Is the prediction worthwhile? Lemon Imports 226 263 Crash Fatality Rate 16.1 16 351 15.8 498 15.6 545 15.2 Find the equation of the regression line ĝ=+...
 Find the regression equation, letting overhead width be the predictor (x) variable. Find the best predicted weight of a seal if the overhead width measured from a photograph is 2.4 cm. Can the prediction be correct? What is wrong with predicting the weight in this case? Use a significance level of 0.05. Overhead Width (cm) 7.4 8.4 9.7 7.5 8.3 8.2 Weight (kg) 151 224 275 153 210 210 Click the icon to view the critical values of the Pearson...
 Find the regression equation letting overhead with be the predictor(s) variable. Find the best predicted weight of a seal the overhead width moured from a photograph is 16 cm. Can the prediction be correct? What is wrong with predicting the weight in this case? Use a significance level of 0.05. Overhead Width (cm) 84 79 82 7.8 Weight (kg) 201 209 190 181 200 Click the loon to view the critical values of the Pearson correlation coeficient The regression equation...
 n
α=0.05
α=0.01
NOTE: To test
H0:
ρ=0
against
H1:
ρ≠0,
reject
H0
if the absolute value of r is greater than the critical value in
the table.
4
0.950
0.990
5
0.878
0.959
6
0.811
0.917
7
0.754
0.875
8
0.707
0.834
9
0.666
0.798
10
0.632
0.765
11
0.602
0.735
12
0.576
0.708
13
0.553
0.684
14
0.532
0.661
15
0.514
0.641
16
0.497
0.623
17
0.482
0.606
18
0.468
0.590
19
0.456
0.575
20
0.444
0.561
25...
n
α=0.05
α=0.01
NOTE: To test
H0:
ρ=0
against
H1:
ρ≠0,
reject
H0
if the absolute value of r is greater than the critical value in
the table.
4
0.950
0.990
5
0.878
0.959
6
0.811
0.917
7
0.754
0.875
8
0.707
0.834
9
0.666
0.798
10
0.632
0.765
11
0.602
0.735
12
0.576
0.708
13
0.553
0.684
14
0.532
0.661
15
0.514
0.641
16
0.497
0.623
17
0.482
0.606
18
0.468
0.590
19
0.456
0.575
20
0.444
0.561
25...
 Find the regression equation, letting the diameter be the predictor (x) variable. Find the best predicted circumference of a marble with a diameter of 1.8 cm. How does the result compare to the actual circumference of 5.7 cm? Use a significance level of 0.05. Baseball Basketball Golf Soccer Tennis Ping-Pong Volleyball 7. 3 2 4.3 4.3 22.3 6.9 4.0 20.5 Circumference 22.9 76.3 13.5 70.1 21.7 12.6 64.4 Click the icon to view the critical values of the Pearson correlation...
 Find the regression equation, letting the first variable be the predictor (x) variable. Using the listed lemon/crash data, where lemon imports are in metric tons and the fatality rates are per 100,000 people, find the best predicted crash fatality rate for a year in which there are 475 metric tons of lemon imports. Is the prediction worthwhile? Lemon Imports 227 262 Crash Fatality Rate 16 15.8 364 15.4 496 15.4 523 15 Find the equation of the regression line ŷ=[]+()x...
 Find the regression equation, letting the first variable be the predictor (x) variable. Find the best predicted Nobel Laureate rate for a country that has 78.3 Internet users per 100 people. How does it compare to the country's actual Nobel Laureate rate of 1.5 per 10 million people? Х i Data Table Click the icon to view the data. Find the equation of the regression line. ŷ=+x (Round the constant to one decimal place as needed. Round the coefficient to...
 Find the regression equation, letting the first variable be the predictor (x) variable. Using the listed lemon/crash data, where lemon imports are in metric tons and the fatality rates are per 100,000 people, find the best predicted crash fatality rate for a year in which there are 400 metric tons of lemon imports. Is the prediction worthwhile? Lemon Imports 226 263 Crash Fatality Rate 16.1 16 351 15.8 498 15.6 545 15.2 Find the equation of the regression line ĝ=+...
Most questions answered within 3 hours.
-
What is aromaticity?
Identify aromatic molecules, especially those containing O, N,
S and B
asked 18 seconds from now -
A rubber solid circular wheel of uniform density spins about it
axis at rate of 60...
asked 11 minutes ago -
DNA evidence from an early human skeleton in Britain, shows that
early inhabitants of were blue...
asked 2 minutes ago -
Financial data for Joel de Paris, Inc., for last year
follow:
Joel de Paris, Inc.
Balance...
asked 11 minutes ago -
To practice Problem-Solving Strategy 19.1 Work in Ideal-gas
Processes.
A cylinder with initial volume V contains...
asked 19 minutes ago -
Depreciation for Partial Periods Bean Delivery Company purchased
a new delivery truck for $35,400 on April...
asked 23 minutes ago -
Q 5.23:
Jonathan has been doing calculations to determine a missing
component. So far he has...
asked 21 minutes ago -
Use indifference curve and the daily income-leisure choice model
to explain graphically the behavior of employees...
asked 42 minutes ago -
Record the following transactions of Fashion Park in a
general journal. Fashion Park must charge 8...
asked 42 minutes ago -
Chapter 08 Python Assignment: Question 1-5
Please I need help in my python course.
Question 1...
asked 46 minutes ago -
1.
In a study of the effectiveness of
a new pain killer,
4646
out of
821821...
asked 1 hour ago -
Compare the equation of the forced vortex to the Bernoulli
equation in terms of:
Assumptions
Flow...
asked 1 hour ago