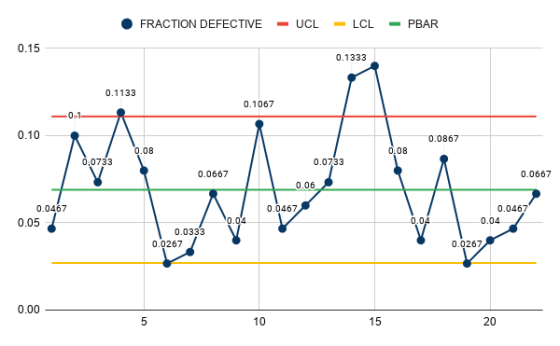
Daily samples of 150 sand filters are removed from Pentair Corporation's assembly line and inspected for...
Daily samples of 150 sand filters are removed from Pentair Corporation's assembly line and inspected for defects. Over the past 22 days, the following information has been gathered. Develop a (95.45% confidence level) p-chart.
| Day | Number of Defective Filters | Day | Number of Defective Filters |
| 1 | 7 | 12 | 9 |
| 2 | 15 | 13 | 11 |
| 3 | 11 | 14 | 20 |
| 4 | 17 | 15 | 21 |
| 5 | 12 | 16 | 12 |
| 6 | 4 | 17 | 6 |
| 7 | 5 | 18 | 13 |
| 8 | 10 | 19 | 4 |
| 9 | 6 | 20 | 6 |
| 10 | 16 | 21 | 7 |
| 11 | 7 | 22 |
10 |
a. What is the p-bar?
b. What is the standard deviation of the p?
c. What is the UCLp = , and the LCLp =
d. Is the process in control? If not, which samples are out of control?
Homework Answers
Z VALUE FOR 95.4% CONFIDENCE = 2
SAMPLE SIZE = 150
NUMBER OF SAMPLES TAKEN = 22
P-BAR = TOTAL NUMBER OF DEFECTS / (SAMPLE SIZE * NUMBER OF
SAMPLES = 229 / (150 * 22) = 0.069
STDEV = SQRT((PBAR * (1 - PBAR)) / SAMPLE SIZE = SQRT((0.069 * (1 -
0.069)) / 150 = 0.021
UCL = PBAR + (Z * STDEV) = 0.069 + (2 * 0.021) = 0.111
LCL = PBAR - (Z * STDEV) = 0.069 - (2 * 0.021) = 0.027
2. N0, THE PROCESS IS NOT IN CONTROL SINCE SAMPLE 4, 6, 14, 15, 19 ARE OUTSIDE THE CONTROL LIMIT.
** Leaving a thumbs-up would really help me out. Let me know if you face any problems.
Add Answer to:
Daily samples of 150 sand filters are removed from Pentair
Corporation's assembly line and inspected for...
17. (10points) One hundred product labels are inspected every day for surface nonconformities. Results for the past...
 17. (10points) One hundred product labels are inspected every day for surface nonconformities. Results for the past 25 days are 22, 29, 25, 17, 20, 16, 34, 11, 31, 29, 15, 10, 33, 23, 27, 15, 17, 17, 19, 22, 23, 27, 29, 33, and 21. Plot the points on graph paper (run chart) and determine if the process is stable. Determine the trial central line and control limits. (Hint: count of defects/unit)
Chapter 7 Table below contains data on examination of medical insurance claims. Every day 50 claims...
Chapter 7 Table below contains data on examination of medical insurance claims. Every day 50 claims were examined. Day Number Nonconforming 1 0 2 3 3 4 4 6 5 5 6 2 7 8 8 9 9 4 10 2 11 6 12 4 13 8 14 0 15 7 16 20 17 6 18 1 19 5 20 7 Set up the fraction nonconforming control chart (p-chart) for this process. Plot the preliminary data in the above table...
The dataset below is the observed number of defects from inspecting 25 successive wafers each containing...
 The dataset below is the observed number of defects from inspecting 25 successive wafers each containing n= 100 chips. Here the wafer is the inspection unit. (a) Create the appropriate control chart to control the data. (b) From the control chart, would you conclude that the process is in statistical control? (c) If any out of control points by Western Electric runs rule 1 are observed, assume they have assignable causes and can be omitted from control limit estimates. Create...
Management at Webster Chemical Company is concerned as to whether caulking tubes are being properly capped....
 Management at Webster Chemical Company is concerned as to whether caulking tubes are being properly capped. If a significant proportion of the tubes are not being sealed, Webster is placing its customers in a messy situation. Tubes are packaged in large boxes of 135. Several boxes are inspected, and the following numbers of leaking tubes are found Tubes Sample 15 16 17 18 Tubes Sample Tubes Sample 4 10 4 4 12 13 20 Total 87 Calculate p-chart three-sigma control...
The results of inspection of DNA samples taken over the past 10 days are given below. Sample size is 100. 10 Day Defectives 2 3 4 6 6 0 6 a) The upper and lower 3-sigma control chart limits are: UCLp...
 The results of inspection of DNA samples taken over the past 10 days are given below. Sample size is 100. 10 Day Defectives 2 3 4 6 6 0 6 a) The upper and lower 3-sigma control chart limits are: UCLp(enter your response as a number between 0 and 1, rounded to three decimal places). LCL(enter your response as a number between 0 and 1, rounded to three decimal places). b) Given the limits in part a, is the process...
The table lists the number of defective 60-watt lightbulbs found in samples of 100 bulbs selected...
The table lists the number of defective 60-watt lightbulbs found in samples of 100 bulbs selected over 25 days from a manufacturing process. Assume that during this time the manufacturing process was not producing an excessively large fraction of defectives. Day 1 2 3 4 5 6 7 8 9 10 Defectives 5 3 6 9 3 4 4 6 6 2 Day 11 12 13 14 15 16 17 18 19 20 Defectives 3 4 3 4 1 3...
A paper mill uses a control chart to Data on Imperfections in Rolls of Paper monitor...
 A paper mill uses a control chart to Data on Imperfections in Rolls of Paper monitor the imperfection in finished Total Total Ils of paper. Production output is umber Number of Number Number of of Rolls Imper- Day Produced fections Day Produced fections inspected for twenty days, and the resulting data are shown here. Use these data to set up a control chart for 218 4 12 18 14 nonconformities per roll of paper. Does the process appear to be...
Judy Holmes Industries has decided to use a p-Chart to monitor the proportion of defective castings produced by their production process. The control limits on these charts will be designed to include...
Judy Holmes Industries has decided to use a p-Chart to monitor the proportion of defective castings produced by their production process. The control limits on these charts will be designed to include 95%95% of the sample proportions when the process is In Control. The operations manager randomly samples 400400 castings at 1616 successively selected time periods and counts the number of defective castings in the sample. Table Control Chart Copy Table Step 8 of 8 : You, acting as the...
Data was collected from a textile finishing process. Samples were collected daily and the number of...
Data was collected from a textile finishing process. Samples were collected daily and the number of nonconformities were recorded. (recall more than one nonconformity can be present on each unit) Day Number of units produced Number of Nonconformities 1 13 60 2 12 43 3 19 55 4 14 44 5 18 55 6 13 40 7 24 61 8 15 49 9 16 66 10 11 41 Using Minitab: 1. Construct an appropriate control chart for the above data....
Dave Green, an analyst at Hyvee, shared his forecasts of the daily Tide sales for days...
Dave Green, an analyst at Hyvee, shared his forecasts of the daily Tide sales for days 1 to 15 with you as given in the table below (actual sales for days 1 to 15 is already given to you in question 4 above). Using Dave’s forecasts given below answer the following questions: Day 1 2 3 4 5 6 7 8 9 10 11 12 13 14 15 Dave's Forecast 20 27 14 14 8 11 18 15 8 24...
 17. (10points) One hundred product labels are inspected every day for surface nonconformities. Results for the past 25 days are 22, 29, 25, 17, 20, 16, 34, 11, 31, 29, 15, 10, 33, 23, 27, 15, 17, 17, 19, 22, 23, 27, 29, 33, and 21. Plot the points on graph paper (run chart) and determine if the process is stable. Determine the trial central line and control limits. (Hint: count of defects/unit)
 The dataset below is the observed number of defects from inspecting 25 successive wafers each containing n= 100 chips. Here the wafer is the inspection unit. (a) Create the appropriate control chart to control the data. (b) From the control chart, would you conclude that the process is in statistical control? (c) If any out of control points by Western Electric runs rule 1 are observed, assume they have assignable causes and can be omitted from control limit estimates. Create...
 Management at Webster Chemical Company is concerned as to whether caulking tubes are being properly capped. If a significant proportion of the tubes are not being sealed, Webster is placing its customers in a messy situation. Tubes are packaged in large boxes of 135. Several boxes are inspected, and the following numbers of leaking tubes are found Tubes Sample 15 16 17 18 Tubes Sample Tubes Sample 4 10 4 4 12 13 20 Total 87 Calculate p-chart three-sigma control...
 The results of inspection of DNA samples taken over the past 10 days are given below. Sample size is 100. 10 Day Defectives 2 3 4 6 6 0 6 a) The upper and lower 3-sigma control chart limits are: UCLp(enter your response as a number between 0 and 1, rounded to three decimal places). LCL(enter your response as a number between 0 and 1, rounded to three decimal places). b) Given the limits in part a, is the process...
 A paper mill uses a control chart to Data on Imperfections in Rolls of Paper monitor the imperfection in finished Total Total Ils of paper. Production output is umber Number of Number Number of of Rolls Imper- Day Produced fections Day Produced fections inspected for twenty days, and the resulting data are shown here. Use these data to set up a control chart for 218 4 12 18 14 nonconformities per roll of paper. Does the process appear to be...
Most questions answered within 3 hours.
-
Question no 2
A housekeeping support department budgets its costs at
SR 40,000 per month plus...
asked 3 minutes ago -
What is the pressure inside a 33.0 L container holding 106.4 kg
of argon gas at...
asked 7 minutes ago -
A 1400Kg sports car accelerates from rest to 90km/h in 7.0s.
What is the average power...
asked 44 minutes ago -
For the following reaction, 0.128 moles of
potassium hydrogen sulfateare mixed with
0.504 moles of potassium...
asked 4 hours ago -
1. What is the present value of $400, three years in the future
if the interest...
asked 4 hours ago -
The labor force minus the number of employed equals the number
of unemployed.
a. True
b....
asked 6 hours ago -
Determine the mass in units of grams [g] of 0.49 moles [mol]
of a new fictitious...
asked 7 hours ago -
A horizontal mass of M=5kg is on a spring and stretched to
x=0.5m when released from...
asked 8 hours ago -
26 of 50
"I have worked at the Arizona Humane Society for ten years, and
have...
asked 8 hours ago -
Compare and contrast zero based budgeting and incremental (or
base year) budgeting.
asked 8 hours ago -
4 pts 10. Which of the following hypothesis would be MOST
difficult to test experimentally? Group...
asked 8 hours ago -
A business owner makes 1,000 items a day. Each day he or she
contributes eight hours...
asked 8 hours ago