

P value
State your conclusion. Would we perform post-hoc procedures for this data?
Homework Answers
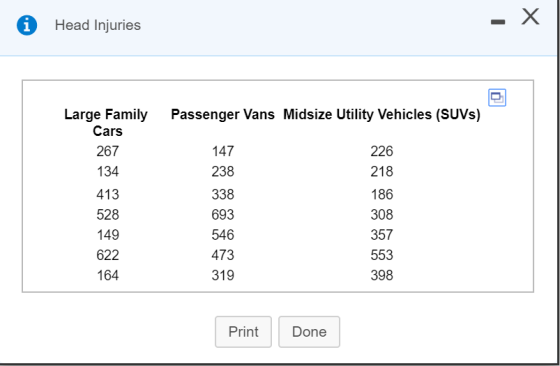
The summary statistics obtained from the given data are as below.
| Large Car | Passenger | SUV | |
| Total | 2277 | 2754 | 2246 |
| n | 7 | 7 | 7 |
| Mean | 325.29 | 393.43 | 320.86 |
| Sum Of Squares | 233903.429 | 212849.7143 | 99076.8572 |
| Variance | 38983.9048 | 35474.9524 | 16512.8095 |
| SD | 197.4434 | 188.3480 | 128.5022 |
_____________________________________
(a) The Hypothesis: Option B
H0: 
H1: At least one mean is different.
(b) Option C: yes the requirements are met.
_____________________________________
The ANOVA table is as below
| Source | SS | DF | Mean Square | F | p |
| Between | 23169.49 | 2 | 11584.74 | 0.382 | 0.6879 |
| Within/Error | 545830.00 | 18 | 30323.89 | ||
| Total | 568999.49 | 20 |
The p Value: The p value is calculated for F = 0.38 for df1 = 2 and df2 = 18 and is = 0.6879 (P value > 0.10)
The Decision Rule:
If p-value is <  , Then reject H0.
The Decision:
Also since p-value (0.6879) is >
(0.01), We Fail to Reject H0.
The Conclusion: There isn't sufficient evidence at the 99% level of significance to warrant rejection of the claim that the head injury for each vehicle type is the same.
No, we would not conduct post hoc procedures for this data.
__________________________________________________________
Calculations For the ANOVA Table:
Overall Mean = [325.29 + 393.43 + 320.86] / 3 = 346.52
SS treatment = SUM [n* (  - overall mean)2] = 7 * (325.29 - 346.52)2 +
7 * (393.43 - 346.52)2 + 7 * (320.86 -
346.52)2 = 23169.49
- overall mean)2] = 7 * (325.29 - 346.52)2 +
7 * (393.43 - 346.52)2 + 7 * (320.86 -
346.52)2 = 23169.49
df1 = k - 1 = 3 - 1 = 2
MSTR = SS treatment/df1 = 23169.49 / 2 = 11584.74
SSerror = SUM (Sum of Squares) = 233903.429 + 212849.7143 + 99076.8572 = 545830
df2 = N - k = 21 - 3 = 18
Therefore MS error = SSerror/df2 = 545830 / 18 = 30323.89
F = MSTR/MSE = 11584.74 / 30323.89 = 0.382
______________________________________________
Mcars = Hvans = MSUV
We were unable to transcribe this image
We were unable to transcribe this image
We were unable to transcribe this image
Add Answer to:
P value
State your conclusion. Would we perform post-hoc procedures for
this data?
A highway safety...
A highway safety institution conducts experiments in which cars are crashed into a fixed barrier at 40 mph. In the institute's 40-mph offset test, 40% of the total width of each vehicle strikes...
A highway safety institution conducts experiments in which cars are crashed into a fixed barrier at 40 mph. In the institute's 40-mph offset test, 40% of the total width of each vehicle strikes a barrier on the driver's side. The barrier's deformable face is made of aluminum honeycomb, which makes the forces in the test similar to those involved in a frontal offset crash between two vehicles of the same weight, each going just less than 40 mph. You are...
A highway safety institution conducts experiments in which cars are crashed into a fixed barrier at...
A highway safety institution conducts experiments in which cars are crashed into a fixed barrier at 40 mph. In the institute's 40-mph offset test, 40% of the total width of each vehicle strikes a barrier on the driver's side. The barrier's deformable face is made of aluminum honeycomb, which makes the forces in the test similar to those involved in a frontal offset crash between two vehicles of the same weight, each going just less than 40 mph. You are...
= Question Help ustomer wants to know whether the mean chest compression resulting from an institute...
 = Question Help ustomer wants to know whether the mean chest compression resulting from an institute crash test is the same for family cars, passenger vans, and trucks. The to the right were collected from the institute's study. Vehicle Type Family Cars Passenger Vans Trucks Chest Compression (mm) 30 36 37 43 43 32 26 31 27 33 27 28 37 31 33 41 27 34 onduct a one-way ANOVA test on the data. terpret your results from (a) at...
Euestion Help Chest Compression (mm) 31 33 32 36 33 23 28 28 30 32 27...
 Euestion Help Chest Compression (mm) 31 33 32 36 33 23 28 28 30 32 27 31 37 29 33 36 A customer wants to know whether the mean chest compression resting from an institute crash test is the same for family cars, passenger Vehicle Type vans, and trucks. The data to the right were collected from the sto's study Family Cars Passenger Vans Trucks a. Conduct a one-way ANOVA bot on the data b. Interpret your results from (a)...
p value? The data in the accompanying table represent the number of corn plants in randomly...
 p value?
The data in the accompanying table represent the number of corn plants in randomly sampled rows (a 17-foot by 5-inch strip) for various types of plots. An agricultural researcher wants to know whether the mean numbers of plants for each plot type are equal. Complete parts (a) through (e) below. B! Click the icon to view the data table. Click the icon to view the table of critical values for the correlation coefficient. гv" эпичує "орту OC. Ho:...
p value?
The data in the accompanying table represent the number of corn plants in randomly sampled rows (a 17-foot by 5-inch strip) for various types of plots. An agricultural researcher wants to know whether the mean numbers of plants for each plot type are equal. Complete parts (a) through (e) below. B! Click the icon to view the data table. Click the icon to view the table of critical values for the correlation coefficient. гv" эпичує "орту OC. Ho:...
 = Question Help ustomer wants to know whether the mean chest compression resulting from an institute crash test is the same for family cars, passenger vans, and trucks. The to the right were collected from the institute's study. Vehicle Type Family Cars Passenger Vans Trucks Chest Compression (mm) 30 36 37 43 43 32 26 31 27 33 27 28 37 31 33 41 27 34 onduct a one-way ANOVA test on the data. terpret your results from (a) at...
 Euestion Help Chest Compression (mm) 31 33 32 36 33 23 28 28 30 32 27 31 37 29 33 36 A customer wants to know whether the mean chest compression resting from an institute crash test is the same for family cars, passenger Vehicle Type vans, and trucks. The data to the right were collected from the sto's study Family Cars Passenger Vans Trucks a. Conduct a one-way ANOVA bot on the data b. Interpret your results from (a)...
 p value?
The data in the accompanying table represent the number of corn plants in randomly sampled rows (a 17-foot by 5-inch strip) for various types of plots. An agricultural researcher wants to know whether the mean numbers of plants for each plot type are equal. Complete parts (a) through (e) below. B! Click the icon to view the data table. Click the icon to view the table of critical values for the correlation coefficient. гv" эпичує "орту OC. Ho:...
p value?
The data in the accompanying table represent the number of corn plants in randomly sampled rows (a 17-foot by 5-inch strip) for various types of plots. An agricultural researcher wants to know whether the mean numbers of plants for each plot type are equal. Complete parts (a) through (e) below. B! Click the icon to view the data table. Click the icon to view the table of critical values for the correlation coefficient. гv" эпичує "орту OC. Ho:...
Most questions answered within 3 hours.
-
a) Draw two water molecules.
b) Clearly name and label the type of bond that exists...
asked 49 minutes ago -
C - Language
Write a loop that sets each array element to the sum of itself...
asked 1 hour ago -
(63
#14)
which of the following statments best describes how chamging
the concentration of the substances...
asked 5 hours ago -
In the following reaction, which element is undergoing
oxidation: Na2SO3 + N2O --> N2 + Na2SO4...
asked 6 hours ago -
Which of the following pairs of ions have the same electron
configuration?
I: Br− and Se2−...
asked 8 hours ago -
The Foremost Composite Materials Company is planning a two-day
sales conference for October 19-20. The conference...
asked 9 hours ago -
3) Illustrate the observed pattern of relatedness of organisms
versus adaptations to specific conditions. This means...
asked 9 hours ago -
In winter a lake has a 0.35 m thick ice layer over 1.10 m of
water....
asked 10 hours ago -
Assuming the following has been encrypted with a Vigenere cipher
below, use the method(s) and assumptions...
asked 10 hours ago -
How would I use switch statements to write a program that will
take an input of...
asked 10 hours ago -
Imagine a reaction in which methane gas combusts at a constant
pressure of 1 atm and...
asked 10 hours ago -
Two parallel wires (each 12 m in length) are separated by a
distance of 0.065 m...
asked 10 hours ago