Question: Draw and explain the economic models such as consumption function and three equation model
Question:
Draw and explain the economic models such as consumption function
and three equation model
Homework Answers
(a) CONSUMPTION FUNCTION MODEL
In economics, consumption function defines a relation between consumption and disposible income or gross national income. It was introduced by Keynes in 1936, and hence called Keynesian consumption function. The classic consumption function defines that the consumer spending is wholly determined by the income and the changes in income. Thus the aggregate savings should increase proportionally as the GDP grows over time. The consumption function my be represented as
C = A+MD
C = Consumer spending
A = Autonomous consumption
M = Marginal propensity to consume
D = Real disposible income
The function is assumed to be stable and static where all expenditure are passively determined by the level of national income. Thus consumption function and independent investment must remain constant for national income to reach equilibrium.
Accordin to Keynes, the consumption function should have the following characteristics
a) Aggregate real consumption expenditure is a stable function of real income
b) The Marginal propensity to consume [MPC] ie; the slope of consumption function must be btween 0 and 1
c) The Average Propensity to Consume [APC] or the proportion of income spent on consumption should be decreasing as income increases.
d) MPC decreases itself or remains constant as income increases

Refer to the figure above
The consumption function PQ is a straight line and OT makes an angle of 45 degree with the origin.. Thus the consumption function satifies all the characteristics.
a) A stable relation exists between C and Y
b) The slope of PQ gives the MPC, with a positive slope. The consumption function PQ is flatter than the 45 degree line and slope is less than that line. Thus slope of PQ = MFC and hence MPC is between 0 and 1
c) At P, APC is infinity. and at T, APC is one. To the left of T, APC is less than 1 and to the right, APC is greater tha 1.ie; to the right of T, C<Y Thus APC decreases from left to right
d) The consumption function is a straight line and the slope is constant funtion at all times ie; cinstant MFC
B) THREE EQUATION MODEL
The 3 equation model is based on three curves,
a) IS curve - Equilibrium in the goods market
b) PC curve - Unemployment - inflation relationship
c) MR curve - How the central bank refers to the shocks
a) IS curve
The equilibrium condition is given by
Y = C+I+G

At any point, the IS curve implies market equilibrium which is the equilibrium condition of Keynesian model. Thus it represents the investment - saving curve
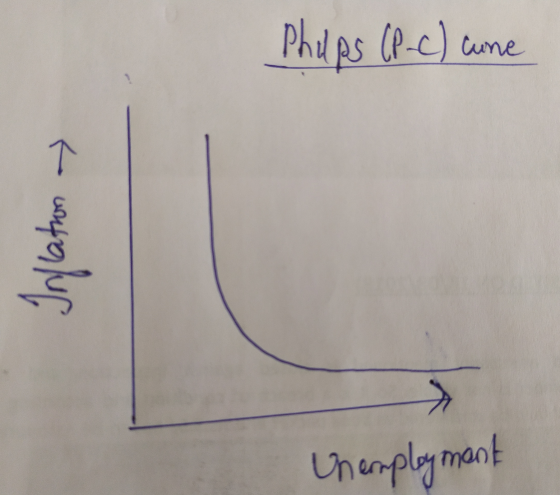
'b) PC curve or the Philips curve
It defines that the inflation and unemployment have a stable and inverted relationship. Thus with economic growth comes the inflation which leads to more jobs and less unempoyment
c) MR curve
It defines the relation between the marginal revenue received by a firm for selling its output and the quantity of utput sold. A firm maximises the profit by producing the quantity of output sold at the intersection of marginal revenue curve and the marginal cost curve
The MR curve for a market with no market control is horizontal The MR curve for a market with market control is negatively sloped and lies below the average revenue curve.
Thus the above three represents the three equation model
Add Answer to:
Question:
Draw and explain the economic models such as consumption function
and three equation model
Question 1 (3.111 points) Which statement is NOT true of economic model building? a) Economic models...
 Question 1 (3.111 points) Which statement is NOT true of economic model building? a) Economic models always reach verifiable results. b) Adding more complexity to models does not always provide greater insights. C) Economic models provide generalizations about economic behavior. d) There may be exceptions to economic models. Question 5 (3.111 points) Individuals do not experience opportunity costs unless external costs occur. a) True Ob) False Question 24 (3.111 points) The national income and product accounts are released quarterly to...
Explain the THREE (3) models of consumption theory and what distinguishes them in terms of marginal...
Explain the THREE (3) models of consumption theory and what distinguishes them in terms of marginal propensity to consume (MPC).
Explain colonial economic policy in terms of the three basic models of development in Africa. Be...
Explain colonial economic policy in terms of the three basic models of development in Africa. Be sure to provide concrete examples for each type of development policy.
Question 1: Make models of cyclobutane and cyclohexane and then carefully draw these models a) Does...
Question 1: Make models of cyclobutane and cyclohexane and then carefully draw these models a) Does anything become apparent to you when you are making one model compared to the other? b) Describe the shapes of these molecules and indicate what types of strain might be present in each. c) Are either of your models "flat" like a hexagon or a square? Question 2: Make a model of cyclopentane. a) Is your model flat like a pentagon? b) Why or...
Three different models of automobiles (A, B, and C) were compared for gasoline consumption. For each...
Three different models of automobiles (A, B, and C) were compared for gasoline consumption. For each model of car, fifteen cars were randomly selected and subjected to standard driving procedures. The average miles/gallon obtained for each model of car and sample standard deviations are shown below. Car A Car B Car C Average Mile Per Gallon 42 49 44 Sample Standard Deviation 4 5 3 Use the above data and test to see if the mean gasoline consumption for all...
Economic model is characterised by the following data: * Private consumption C = 800 + 0.9*DI...
 Economic model is characterised by the following data:
* Private consumption C = 800 + 0.9*DI
* Gross investment Ig = 400
* Government spending G = 500
* Sum of Taxes T = 300
* Disposable income DI = Y – T
Calculate:
* Equilibrium level of income Y (Y= 14300)
* Private consumption at macroeconomic equilibrium C =
13400
Develop equation of saving and calculate amount of saving at
the point of macroeconomic equilibrium. S=. 600
Task 4....
Economic model is characterised by the following data:
* Private consumption C = 800 + 0.9*DI
* Gross investment Ig = 400
* Government spending G = 500
* Sum of Taxes T = 300
* Disposable income DI = Y – T
Calculate:
* Equilibrium level of income Y (Y= 14300)
* Private consumption at macroeconomic equilibrium C =
13400
Develop equation of saving and calculate amount of saving at
the point of macroeconomic equilibrium. S=. 600
Task 4....
Explain the three inventory control models and the driving factor in each model. Provide examples for...
Explain the three inventory control models and the driving factor in each model. Provide examples for each one using current companies.
a) for each of the above models, explain why it is not a linear model b)...
 a) for each of the above models, explain why it is not a linear
model
b) Prpose a change to model M1 so that it becomes linear
c) Write down the likelihood for n data points (xi1, Yi) from
model (M2)
Consider three models for a response Y, and two predictors a and , with additive errors 0,02).
a) for each of the above models, explain why it is not a linear
model
b) Prpose a change to model M1 so that it becomes linear
c) Write down the likelihood for n data points (xi1, Yi) from
model (M2)
Consider three models for a response Y, and two predictors a and , with additive errors 0,02).
What is the purpose of an economic model? Why do economists make assumptions in developing models?
What is the purpose of an economic model? Why do economists make assumptions in developing models?
 Question 1 (3.111 points) Which statement is NOT true of economic model building? a) Economic models always reach verifiable results. b) Adding more complexity to models does not always provide greater insights. C) Economic models provide generalizations about economic behavior. d) There may be exceptions to economic models. Question 5 (3.111 points) Individuals do not experience opportunity costs unless external costs occur. a) True Ob) False Question 24 (3.111 points) The national income and product accounts are released quarterly to...
 Economic model is characterised by the following data:
* Private consumption C = 800 + 0.9*DI
* Gross investment Ig = 400
* Government spending G = 500
* Sum of Taxes T = 300
* Disposable income DI = Y – T
Calculate:
* Equilibrium level of income Y (Y= 14300)
* Private consumption at macroeconomic equilibrium C =
13400
Develop equation of saving and calculate amount of saving at
the point of macroeconomic equilibrium. S=. 600
Task 4....
Economic model is characterised by the following data:
* Private consumption C = 800 + 0.9*DI
* Gross investment Ig = 400
* Government spending G = 500
* Sum of Taxes T = 300
* Disposable income DI = Y – T
Calculate:
* Equilibrium level of income Y (Y= 14300)
* Private consumption at macroeconomic equilibrium C =
13400
Develop equation of saving and calculate amount of saving at
the point of macroeconomic equilibrium. S=. 600
Task 4....
 a) for each of the above models, explain why it is not a linear
model
b) Prpose a change to model M1 so that it becomes linear
c) Write down the likelihood for n data points (xi1, Yi) from
model (M2)
Consider three models for a response Y, and two predictors a and , with additive errors 0,02).
a) for each of the above models, explain why it is not a linear
model
b) Prpose a change to model M1 so that it becomes linear
c) Write down the likelihood for n data points (xi1, Yi) from
model (M2)
Consider three models for a response Y, and two predictors a and , with additive errors 0,02).
Most questions answered within 3 hours.
-
The mean waiting time at the drive-through of a fast-food
restaurant from the time an order...
asked 10 minutes ago -
The pitch (p) of a helix is defined as p = dn, in which n is...
asked 12 minutes ago -
Do you agree that the declining stock of social capital is the
blame for the failure...
asked 16 minutes ago -
A researcher is interested in whether coffee consumption helps
with performance on reading comprehension tasks. The...
asked 26 minutes ago -
it has been estimated since the beginning of the human race that
about 133 metric ton...
asked 31 minutes ago -
Where must Medicare prescription drug plans allow for
participants to fill their prescriptions?
asked 34 minutes ago -
Five moles of monatomic ideal gas have initial pressure 2.50 ×
103 Pa and initial volume...
asked 49 minutes ago -
A resistor and the capacitor are used to control the timing in
the RC circuit of...
asked 49 minutes ago -
Living in a group could bring several disadvantages to an
individual. What are some of the...
asked 1 hour ago -
Complete and balance the following reactions. In case of no
reaction occurring write NR.
Mix #1:...
asked 1 hour ago -
If an economy consumes 75% of any increase in income, then an
increase in autonomous investment...
asked 1 hour ago -
A shotputter throws the shot with an initial speed of 15.8 m/s
at a 38.0 ∘...
asked 1 hour ago