Due Since Yesterday, need it ASAP please!
Data is there already. if you can't do it don't mess with it. You asked the same thing yesterday.
Homework Answers
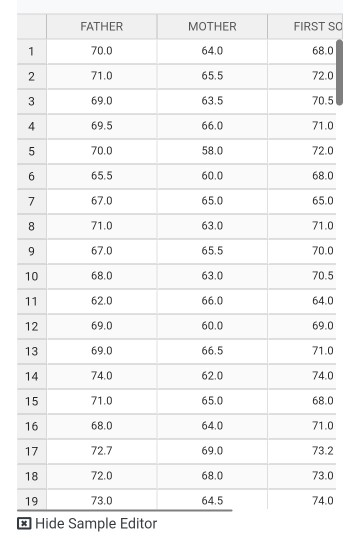
3. The variables in the data set are Father, Mother and many more.
4. The output is:
| Mother | |
| count | 19 |
| mean | 64.132 |
| median | 64.500 |
| minimum | 58 |
| maximum | 69 |
| midrange | 63.5 |
5. The output is:
| Mother | |
| count | 19 |
| minimum | 58 |
| maximum | 69 |
| range | 11 |
| sample variance | 7.551 |
| sample standard deviation | 2.748 |
6. The boxplot is:
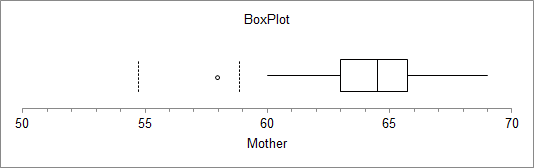
Therefore, the outlier is 58.
7, 8 and 9 cannot be answered because Column 4 is not attached with the question. I am really sorry.
10. The 5-number summary for Column 2 is:
| Mother | |
| minimum | 58 |
| 1st quartile | 63.000 |
| median | 64.500 |
| 3rd quartile | 65.750 |
| maximum | 69 |
The 5-number summary for Column 2 cannot be determined because Column 4 is not attached with the question.
11. Column 4 is not attached with the question.
12. The histogram is:
![10 7 6 5 4 3 2 1 (65.2, 68.8] [58, 61.6 (61.6, 65.2] (68.8, 72.4] ay Ln st](http://img.homeworklib.com/questions/5ac64f40-517c-11eb-a898-895cb2c6c474.png?x-oss-process=image/resize,w_560)
13. Column 4 is not attached with the question.
Please give me a thumbs-up as I answered all of the questions which I could. Thanks!
Add Answer to:
Due Since Yesterday, need it ASAP please!
Data is there already. if you can't do it...
Data for a force sensor is given in the table below (Force is the input, x,...
 Data for a force sensor is given in the table below (Force is the input, x, Voltage is the output, y.). a. Find the slope and y-intercept of the least-squares best-fit line through the data. b. Estimate the standard error of the fit. C. Find the 95% confidence interval of the best-fit line. Force (N) Vout (V) 62.0 1.05 63.0 1.41 64.0 1.93 65.0 2.46 66.0 3.03 67.0 3.59 68.0 3.88 69.0 4.48 70.0 5.04 71.0 5.51
The accompanying data are lengths (nches) of bears. Find Q3 EB Click the icon to view...
 The accompanying data are lengths (nches) of bears. Find Q3 EB Click the icon to view the bear length data. Type an integer or a decimal. Do not round.) Bear Lengths 36.0 36.5 40.0 40.0 40.5 43.0 44.0 45.5 45.5 47.5 47.5 48.5 E 49.0 49.5 52.0 52.5 53.5 53.5 53.5 57.0 57.3 58.0 58.5 59.0 9.0 60.5 60.5 60.5 60.5 62.0 62.5 62.5 62.5 63.0 63.5 63.5 64.0 64.5 64.5 65.5 67.0 67.5 68.0 68.5 70.0 71.0 71.5 71.5...
I can't attach the data due to the file being real large i can email it...
I can't attach the data due to the file being real large i can email it to you so i can have your help on it # Assignment 1 # R Programming Language # ---- Why do Exploratory Data Analysis (EDA)? ---- # We will be looking at ## identifying outliers ## null values ## generating plots ## examining correlations # -------------------------------------------------------------- # In this video we will cover: ## univariate plots for continuous variables (boxlots, historgrams) ## bivariate plots...
Write a program in java. You are tasked with writing an application that will keep track...
Write a program in java. You are tasked with writing an application that will keep track of Insurance Policies. Create a Policy class called InsurancePolicies.java that will model an insurance policy for a single person. Use the following guidelines to create the Policy class: • An insurance policy has the following attributes: o Policy Number o Provider Name o Policyholder’s First Name o Policyholder’s Last Name o Policyholder’s Age o Policyholder’s Smoking Status (will be “smoker” or “non-smoker”) o Policyholder’s...
sunspot.year is a built-in R time series dataset which gives the mean yearly numbers of sunspots...
sunspot.year is a built-in R time series dataset which gives the mean yearly numbers of sunspots from 1700 to 1988 rounded to one digit. This data is maintained up until the current date at WDC-SILSO, Royal Observatory of Belgium. We are interested in some descriptive statistics related to the sunspot.year time series. We can access this data directly and convert the time series into a vector by using the assignment x <- as.vector(sunspot.year). (In R use ?sunspot.year for info on...
You are required to write a program to draw dots using the data # given in...
You are required to write a program to draw dots using the data # given in the variable coords_list below. The variable coords_list # contains a list of (x, y) coordinate pairs. Each (x, y) pair # specifies a position on the screen. # # Write a program to draw dots at the positions in the list. # All the dots are to be of the size defined in the variable supplied. # If x in a pair (x, y)...
 Data for a force sensor is given in the table below (Force is the input, x, Voltage is the output, y.). a. Find the slope and y-intercept of the least-squares best-fit line through the data. b. Estimate the standard error of the fit. C. Find the 95% confidence interval of the best-fit line. Force (N) Vout (V) 62.0 1.05 63.0 1.41 64.0 1.93 65.0 2.46 66.0 3.03 67.0 3.59 68.0 3.88 69.0 4.48 70.0 5.04 71.0 5.51
 The accompanying data are lengths (nches) of bears. Find Q3 EB Click the icon to view the bear length data. Type an integer or a decimal. Do not round.) Bear Lengths 36.0 36.5 40.0 40.0 40.5 43.0 44.0 45.5 45.5 47.5 47.5 48.5 E 49.0 49.5 52.0 52.5 53.5 53.5 53.5 57.0 57.3 58.0 58.5 59.0 9.0 60.5 60.5 60.5 60.5 62.0 62.5 62.5 62.5 63.0 63.5 63.5 64.0 64.5 64.5 65.5 67.0 67.5 68.0 68.5 70.0 71.0 71.5 71.5...
Most questions answered within 3 hours.
-
A 1400Kg sports car accelerates from rest to 90km/h in 7.0s.
What is the average power...
asked 29 minutes ago -
For the following reaction, 0.128 moles of
potassium hydrogen sulfateare mixed with
0.504 moles of potassium...
asked 4 hours ago -
1. What is the present value of $400, three years in the future
if the interest...
asked 4 hours ago -
The labor force minus the number of employed equals the number
of unemployed.
a. True
b....
asked 6 hours ago -
Determine the mass in units of grams [g] of 0.49 moles [mol]
of a new fictitious...
asked 7 hours ago -
A horizontal mass of M=5kg is on a spring and stretched to
x=0.5m when released from...
asked 8 hours ago -
26 of 50
"I have worked at the Arizona Humane Society for ten years, and
have...
asked 8 hours ago -
Compare and contrast zero based budgeting and incremental (or
base year) budgeting.
asked 8 hours ago -
4 pts 10. Which of the following hypothesis would be MOST
difficult to test experimentally? Group...
asked 8 hours ago -
A business owner makes 1,000 items a day. Each day he or she
contributes eight hours...
asked 8 hours ago -
A
circular loop in the plane of a paper lies inca0.65 T magnetic
field pointing into...
asked 9 hours ago -
A business owner is trying to decide whether to buy, rent, or
lease office space and...
asked 9 hours ago