Please solve the questions using R language and attach the script with it!!!
zoom it if the picture is not clear.
Please solve the questions using R language and attach the script with it!!!
Please solve the questions using R language and attach the script with it!!!
Homework Answers
(a) The correct answer is p*(1-p)/n
(b)The correct answer is sqrt(p*(1-p)/n)
(c)
(d)V(x)=npq if x represents the number of heads in n tosses and it follows the Binomial distribution with parameter n(sample size=3901) and p(probability of success, where success refers getting head in a toss).
So standard deviation of X is sqrt(n*p*(1-p)) where is ptot.
(e) we know critical value is 2.053749

From this we can find confidence interval and others
answers.

![#(e)to find the criti cal value we need z1 such that P(lz]kz1)=.96 (from standard normal distribution) 1-gnorm(0.02 0.1.1owe](http://img.homeworklib.com/questions/aa3ddae0-5618-11eb-bdd2-61423e270bca.png?x-oss-process=image/resize,w_560) (f)96% ci
(.6250862,.6566364)
(f)96% ci
(.6250862,.6566364)
(g)length of ci is 0.03155023
(H)sample size should be 750 approximately. in R code picture we have found
the value of n solving this equation.
in R code picture we have found
the value of n solving this equation.
Add Answer to:
Please solve the questions using R language and attach
the script with it!!!
zoom it if...
*ANSWER USING R-SCRIPT* We desire to know the probability that a voter supports a controversial rose...
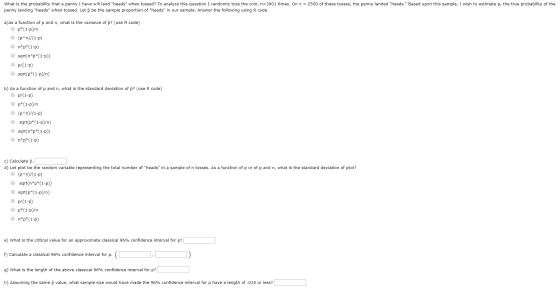
*ANSWER USING R-SCRIPT* We desire to know the probability that a voter supports a controversial rose proposal. From a random sample of 3100, x =1331 voters support the rose proposal. Let phat be the sample proportion supporting the rose proposal. Answer the following: a) what is the variance of p hat b) As a function of p, what is the standard deviation of p hat c) Calculate p hat d) Let ptot be the random variable representing the voters in...
ANSWER ALL OF THE QUESTIONS WITH R CODE (SHOW ALL THE STEPS FOR THE R CODE!)...
 ANSWER ALL OF THE QUESTIONS WITH R CODE (SHOW ALL THE STEPS FOR
THE R CODE!) THANK YOU!!
R problems For questions 1 and 2, load in and attach the Getting to Know You Survey for Spring 2018 using the following code: NoU <-read. csr(file = "http://users, stat . umn .edu/~kinne 174/Getting2NoUS 18 .csv", header = TRUE) attach(NoU) Assume that this survey is a random sample drawn from the population of interest which is all University of Minnesota students. 1....
ANSWER ALL OF THE QUESTIONS WITH R CODE (SHOW ALL THE STEPS FOR
THE R CODE!) THANK YOU!!
R problems For questions 1 and 2, load in and attach the Getting to Know You Survey for Spring 2018 using the following code: NoU <-read. csr(file = "http://users, stat . umn .edu/~kinne 174/Getting2NoUS 18 .csv", header = TRUE) attach(NoU) Assume that this survey is a random sample drawn from the population of interest which is all University of Minnesota students. 1....
PLEASE INSERT R SCRIPT We wish to compare the expected values, μΧ andHy of two independent...
 PLEASE INSERT R SCRIPT
We wish to compare the expected values, μΧ andHy of two independent normal populations, say X and Y, with known standard deviations σχ-8.3 and Ơy-10.1 . we take a random sample of size 13 from X ( X1M, ,x13 ) and a random sample of size 7 from Y ( Yi,½, , ) as follows: X: 0.54, -3.67, 1.41, 23.51, 20.77, 15.90, 16.70, 2.48, 12.27, 2.64, 22.12, 14.03, 17.80 Y: 21.22, 12.61, 15.04, 14.51, 10.91, -4.90,...
PLEASE INSERT R SCRIPT
We wish to compare the expected values, μΧ andHy of two independent normal populations, say X and Y, with known standard deviations σχ-8.3 and Ơy-10.1 . we take a random sample of size 13 from X ( X1M, ,x13 ) and a random sample of size 7 from Y ( Yi,½, , ) as follows: X: 0.54, -3.67, 1.41, 23.51, 20.77, 15.90, 16.70, 2.48, 12.27, 2.64, 22.12, 14.03, 17.80 Y: 21.22, 12.61, 15.04, 14.51, 10.91, -4.90,...
Solve using R and show R code Instruction: Please submit your R code along with a...
 Solve using R and show R code
Instruction: Please submit your R code along with a brief write-up of the solutions. Some of the questions below can be answered with very little or no programming. However, write code that outputs the final answer and dos not ryuira uper calceulatioms. Q.N. 1) The mammals data set in the MASS package records brain size and body size of 62 different mammals a) Fit a regresion model to describe the relation between brain...
Solve using R and show R code
Instruction: Please submit your R code along with a brief write-up of the solutions. Some of the questions below can be answered with very little or no programming. However, write code that outputs the final answer and dos not ryuira uper calceulatioms. Q.N. 1) The mammals data set in the MASS package records brain size and body size of 62 different mammals a) Fit a regresion model to describe the relation between brain...
Using R to solve these questions: 1.Consider the following dataset: fuel <- c(0.95, 0.52, 0.82...
Using R to solve these questions: 1.Consider the following dataset: fuel <- c(0.95, 0.52, 0.82, 0.89, 0.81) The numbers correspond to the amount of fuel burnt by a new type of high-efficiency engine under a randomised test load. A value of 1 corresponds to the same fuel efficiency as the old engine, values greater than one correspond to more fuel burned (hence lower efficiency) and values less than one correspond to greater efficiency. (a) One-sided or two-sided test? Justify. (b)...
Please help me write these in R script / Code 1, Suppose you're on a game...
Please help me write these in R script / Code 1, Suppose you're on a game show, and you're given the choice of three doors. Behind one door is a car; behind the others, goats. You pick a door, say #1, and the host, who knows what's behind the doors, opens another door, say #3, which has a goat. He then says to you, "Do you want to pick door #2?" What is the probability of winning the car if...
Use R - stuido 6. Consider a fair coin. If Y = # of tosses until first H, what are P(success), EY...
Use R - stuido 6. Consider a fair coin. If Y = # of tosses until first H, what are P(success), EY, and VY? 7. Next, take a quarter and record # of tosses until first H. Do this experiment 30 times: so that your first experiment consists of your tosses up to your first H, and you record the number of T before the coin came up heads. Then you pretend to start over: reset your count and toss...
Use R instead of a calculator for Questions 5 and 6. Please attach the R commands...
 Use R instead of a calculator for Questions 5 and 6. Please attach the R commands output and graphs that you used to answer the question. The R output alone is not an answer to the question. Please write a sentence or two to properly answer each question. Assume that the distribution of the duration of human pregnancies can be approxi- mated with a normal distribution with a mean of 266 days and a standard deviation of 16 days (a)...
Please answer all questions Question 30 1 pts Solve the problem. To help consumers assess the...
 Please answer all questions
Question 30 1 pts Solve the problem. To help consumers assess the risks they are taking, the Food and Drug Administration (FDA) publishes the amount of nicotine found in all commercial brands of cigarettes. A new cigarette has recently been marketed. The FDA tests on this cigarette yielded mean nicotine content of 24.4 milligrams and standard deviation of 2.2 milligrams for a sample of r9 cigarettes. Construct a 95% confidence interval for the mean nicotine content...
Please answer all questions
Question 30 1 pts Solve the problem. To help consumers assess the risks they are taking, the Food and Drug Administration (FDA) publishes the amount of nicotine found in all commercial brands of cigarettes. A new cigarette has recently been marketed. The FDA tests on this cigarette yielded mean nicotine content of 24.4 milligrams and standard deviation of 2.2 milligrams for a sample of r9 cigarettes. Construct a 95% confidence interval for the mean nicotine content...
Solve it using matlab and there is an example for a similar one i put •...
 Solve it using matlab and there is an example for a similar
one i put
• Write a function calculate_mean_ci(). The inputs to this function are of the form (x, sigma, level). These are x: a numeric vector. sigma : population standard deviation. level : the confidence level given as a percentage, e.g., 95. • The output is a vector of length two of the form (lwr, upr), where lwr = - 20.025 4 and upr = 1 + 20.025...
Solve it using matlab and there is an example for a similar
one i put
• Write a function calculate_mean_ci(). The inputs to this function are of the form (x, sigma, level). These are x: a numeric vector. sigma : population standard deviation. level : the confidence level given as a percentage, e.g., 95. • The output is a vector of length two of the form (lwr, upr), where lwr = - 20.025 4 and upr = 1 + 20.025...
 ANSWER ALL OF THE QUESTIONS WITH R CODE (SHOW ALL THE STEPS FOR
THE R CODE!) THANK YOU!!
R problems For questions 1 and 2, load in and attach the Getting to Know You Survey for Spring 2018 using the following code: NoU <-read. csr(file = "http://users, stat . umn .edu/~kinne 174/Getting2NoUS 18 .csv", header = TRUE) attach(NoU) Assume that this survey is a random sample drawn from the population of interest which is all University of Minnesota students. 1....
ANSWER ALL OF THE QUESTIONS WITH R CODE (SHOW ALL THE STEPS FOR
THE R CODE!) THANK YOU!!
R problems For questions 1 and 2, load in and attach the Getting to Know You Survey for Spring 2018 using the following code: NoU <-read. csr(file = "http://users, stat . umn .edu/~kinne 174/Getting2NoUS 18 .csv", header = TRUE) attach(NoU) Assume that this survey is a random sample drawn from the population of interest which is all University of Minnesota students. 1....
 PLEASE INSERT R SCRIPT
We wish to compare the expected values, μΧ andHy of two independent normal populations, say X and Y, with known standard deviations σχ-8.3 and Ơy-10.1 . we take a random sample of size 13 from X ( X1M, ,x13 ) and a random sample of size 7 from Y ( Yi,½, , ) as follows: X: 0.54, -3.67, 1.41, 23.51, 20.77, 15.90, 16.70, 2.48, 12.27, 2.64, 22.12, 14.03, 17.80 Y: 21.22, 12.61, 15.04, 14.51, 10.91, -4.90,...
PLEASE INSERT R SCRIPT
We wish to compare the expected values, μΧ andHy of two independent normal populations, say X and Y, with known standard deviations σχ-8.3 and Ơy-10.1 . we take a random sample of size 13 from X ( X1M, ,x13 ) and a random sample of size 7 from Y ( Yi,½, , ) as follows: X: 0.54, -3.67, 1.41, 23.51, 20.77, 15.90, 16.70, 2.48, 12.27, 2.64, 22.12, 14.03, 17.80 Y: 21.22, 12.61, 15.04, 14.51, 10.91, -4.90,...
 Solve using R and show R code
Instruction: Please submit your R code along with a brief write-up of the solutions. Some of the questions below can be answered with very little or no programming. However, write code that outputs the final answer and dos not ryuira uper calceulatioms. Q.N. 1) The mammals data set in the MASS package records brain size and body size of 62 different mammals a) Fit a regresion model to describe the relation between brain...
Solve using R and show R code
Instruction: Please submit your R code along with a brief write-up of the solutions. Some of the questions below can be answered with very little or no programming. However, write code that outputs the final answer and dos not ryuira uper calceulatioms. Q.N. 1) The mammals data set in the MASS package records brain size and body size of 62 different mammals a) Fit a regresion model to describe the relation between brain...
 Use R instead of a calculator for Questions 5 and 6. Please attach the R commands output and graphs that you used to answer the question. The R output alone is not an answer to the question. Please write a sentence or two to properly answer each question. Assume that the distribution of the duration of human pregnancies can be approxi- mated with a normal distribution with a mean of 266 days and a standard deviation of 16 days (a)...
 Please answer all questions
Question 30 1 pts Solve the problem. To help consumers assess the risks they are taking, the Food and Drug Administration (FDA) publishes the amount of nicotine found in all commercial brands of cigarettes. A new cigarette has recently been marketed. The FDA tests on this cigarette yielded mean nicotine content of 24.4 milligrams and standard deviation of 2.2 milligrams for a sample of r9 cigarettes. Construct a 95% confidence interval for the mean nicotine content...
Please answer all questions
Question 30 1 pts Solve the problem. To help consumers assess the risks they are taking, the Food and Drug Administration (FDA) publishes the amount of nicotine found in all commercial brands of cigarettes. A new cigarette has recently been marketed. The FDA tests on this cigarette yielded mean nicotine content of 24.4 milligrams and standard deviation of 2.2 milligrams for a sample of r9 cigarettes. Construct a 95% confidence interval for the mean nicotine content...
 Solve it using matlab and there is an example for a similar
one i put
• Write a function calculate_mean_ci(). The inputs to this function are of the form (x, sigma, level). These are x: a numeric vector. sigma : population standard deviation. level : the confidence level given as a percentage, e.g., 95. • The output is a vector of length two of the form (lwr, upr), where lwr = - 20.025 4 and upr = 1 + 20.025...
Solve it using matlab and there is an example for a similar
one i put
• Write a function calculate_mean_ci(). The inputs to this function are of the form (x, sigma, level). These are x: a numeric vector. sigma : population standard deviation. level : the confidence level given as a percentage, e.g., 95. • The output is a vector of length two of the form (lwr, upr), where lwr = - 20.025 4 and upr = 1 + 20.025...
Most questions answered within 3 hours.
-
A resistor and the capacitor are used to control the timing in
the RC circuit of...
asked 10 minutes ago -
Five moles of monatomic ideal gas have initial pressure 2.50 ×
103 Pa and initial volume...
asked 10 minutes ago -
Living in a group could bring several disadvantages to an
individual. What are some of the...
asked 28 minutes ago -
Complete and balance the following reactions. In case of no
reaction occurring write NR.
Mix #1:...
asked 33 minutes ago -
If an economy consumes 75% of any increase in income, then an
increase in autonomous investment...
asked 36 minutes ago -
A shotputter throws the shot with an initial speed of 15.8 m/s
at a 38.0 ∘...
asked 52 minutes ago -
Debra and Merina sell electronic equipment and supplies through
their partnership. They wish to expand their...
asked 53 minutes ago -
How does a linear regression allow you to better estimate
trends, costs, and other factors in...
asked 1 hour ago -
1. (15%) Describe the difference between a pull (Kanban), push
and CONWIP production systems.
asked 57 minutes ago -
QUESTION 5
The total area under the Z distribution curve is equal to:
a.
10
b....
asked 1 hour ago -
Using Python
The variables x and y refer to numbers. Write a code segment
that prompts...
asked 1 hour ago -
If
the coefficient of static friction between a box and the floor is
0.35 with what...
asked 1 hour ago