
Homework Answers
Answer :-
Refer to the figures below :

Figure (a) : U.S. government security market.
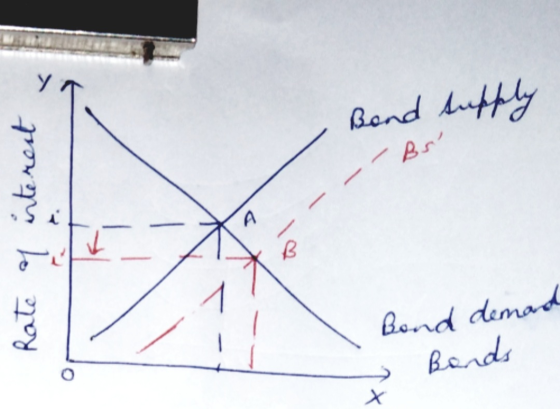
Figure (b) : Corporate bond market.
According to the article, it can be seen that in the Corporate bond market, rate of interest has fallen because of increase in the supply of bonds in Corporate bond market, which has shifted the bond's supply curve rightwards and new equilibrium occurs at point B, where rate of interest has fallen.
Investors are willing to buy more corporate bonds because profitability attached to it and firms wants to take advantage of lower interest rates. In government security market, demand for governments bonds has fallen.
Add Answer to:
In this question, we are going to use the demand and supply model for bonds to...
If we model a tax on the demand side, then the equilibrium price we reach will...
 If we model a tax on the demand side, then the equilibrium price we reach will be higher than if we model the tax on suppliers. True False When we model a tax, the new equilibrium price represents the price paid by the buyers the revenue raised from the tax O the price the sellers keep O the amount of the tax Question 39 (1 point) Which of the following is not an appropriate way to model a tax? shifting...
Supply and demand of labor market is very similar as supply and demand of goods and...
Supply and demand of labor market is very similar as supply and demand of goods and service market. The difference is the focus: labor. So the price of labor market is wage rate and quantity represent the quantity of labor hour. Just as other S&D factors, price (wage rate) change will not affect the labor supply or demand. factors other than price (wage rate) will shift the supply and demand. Since demand for labor is from companies, you must take...
2. Consider the market for cinnamon. a) Draw a supply and demand model that reflects that...
 2. Consider the market for cinnamon. a) Draw a supply and demand model that reflects that this market is in equilibrium at s.3 an ournce and I million ounces. To receive credit, fully label all axes and functions, as well as the market eunibium price and quantity. IO points) new harvesting technique allows for much cheaper production of cinnamon. At the same time. b) A cinnamon rolls are getting more and more popular around the world. Draw the impact of...
3) (10 points total) You have the following expressions for bond demand and bond supply respectively:...
 3) (10 points total) You have the following expressions for bond demand and bond supply respectively: BD: P 200-3Q B: P 50 +2Q a) (2 points) Solve for the equilibrium quantity and price in this bond market (please show work) b) (4 points for correct and completely labeled diagram) Draw a demand and supply diagram and locate this initial point as point A. Now conditions change.... bond demand remains the same but bond supply changes and is now: BS: P-...
QUESTION 1 If firms decide to raise more funds through the sale of bonds, interest rates...
QUESTION 1 If firms decide to raise more funds through the sale of bonds, interest rates will rise. True False 1 points QUESTION 2 If the price of bonds is higher than the market equilibrium then their price will fall and interest rates will fall as well. True False 1 points QUESTION 3 As explained in the text, assets may be financial or non-financial. True False 1 points QUESTION 4 In deciding what assets to hold, people...
Question When we put supply and demand together, we have: equilibrium a market a surplus a...
Question When we put supply and demand together, we have: equilibrium a market a surplus a shortage Question Recall the video "Supply and Demand Shifts: Coffee Negative Supply Shock." The ice-storm causes the ______ curve to shift to the left. Price _______ and so manufacturers spend _______ trying to get everything out of their fields. demand; increases; more time and labor supply; increases; less time and labor supply; decreases; less time and labor supply; increases; more time and labor Question...
) Use an Aggregate Demand – Aggregate Supply model beginning at full employment (RGDP=PGDP) to show...
 ) Use an Aggregate Demand – Aggregate Supply model beginning at
full employment (RGDP=PGDP) to show the effects that an “easy
money” policy of low interest rates and easy credit by the Fed
would have on the U.S. economy.
LRAS SRAS To AD Y Yo
) Use an Aggregate Demand – Aggregate Supply model beginning at
full employment (RGDP=PGDP) to show the effects that an “easy
money” policy of low interest rates and easy credit by the Fed
would have on the U.S. economy.
LRAS SRAS To AD Y Yo
S(p) = 0 for p A demand function and a supply function for the same commodity...
 S(p) = 0 for p A demand function and a supply function for the same commodity is given. D(P) = 35 - 7 In p million units; ſo for p <7 million units; 13(1.081P) for p 27 p dollars per unit (a) Locate the shutdown point. (Round your answers to three decimal places.) (Ps, SP)) = Write a sentence of interpretation for this point. Producers are willing to supply million units at a market price of $ per unit. Below...
7. Suppose that the demand and supply of money in the U.S. can be depicted by...
 7. Suppose that the demand and supply of money in the U.S. can be depicted by each of the graphs below. For each situation, assume that the overall price level in the economy cannot change (i.e. it is a "short-run" analysis). (30 total points) a) Show how the money market would be affected in the graph if the Federal Reserve Board in the U.S. decides to sell bonds to the private bond market. . Describe what would happen (if anything)...
3 Graph (20 points) Use Demand and supply diagram and draw graphs to explain why the...
 3 Graph (20 points) Use Demand and supply diagram and draw graphs to explain why the burden of tax falls more heavily on the side of the market that is less elastic.
 If we model a tax on the demand side, then the equilibrium price we reach will be higher than if we model the tax on suppliers. True False When we model a tax, the new equilibrium price represents the price paid by the buyers the revenue raised from the tax O the price the sellers keep O the amount of the tax Question 39 (1 point) Which of the following is not an appropriate way to model a tax? shifting...
 2. Consider the market for cinnamon. a) Draw a supply and demand model that reflects that this market is in equilibrium at s.3 an ournce and I million ounces. To receive credit, fully label all axes and functions, as well as the market eunibium price and quantity. IO points) new harvesting technique allows for much cheaper production of cinnamon. At the same time. b) A cinnamon rolls are getting more and more popular around the world. Draw the impact of...
 3) (10 points total) You have the following expressions for bond demand and bond supply respectively: BD: P 200-3Q B: P 50 +2Q a) (2 points) Solve for the equilibrium quantity and price in this bond market (please show work) b) (4 points for correct and completely labeled diagram) Draw a demand and supply diagram and locate this initial point as point A. Now conditions change.... bond demand remains the same but bond supply changes and is now: BS: P-...
 ) Use an Aggregate Demand – Aggregate Supply model beginning at
full employment (RGDP=PGDP) to show the effects that an “easy
money” policy of low interest rates and easy credit by the Fed
would have on the U.S. economy.
LRAS SRAS To AD Y Yo
) Use an Aggregate Demand – Aggregate Supply model beginning at
full employment (RGDP=PGDP) to show the effects that an “easy
money” policy of low interest rates and easy credit by the Fed
would have on the U.S. economy.
LRAS SRAS To AD Y Yo
 S(p) = 0 for p A demand function and a supply function for the same commodity is given. D(P) = 35 - 7 In p million units; ſo for p <7 million units; 13(1.081P) for p 27 p dollars per unit (a) Locate the shutdown point. (Round your answers to three decimal places.) (Ps, SP)) = Write a sentence of interpretation for this point. Producers are willing to supply million units at a market price of $ per unit. Below...
 7. Suppose that the demand and supply of money in the U.S. can be depicted by each of the graphs below. For each situation, assume that the overall price level in the economy cannot change (i.e. it is a "short-run" analysis). (30 total points) a) Show how the money market would be affected in the graph if the Federal Reserve Board in the U.S. decides to sell bonds to the private bond market. . Describe what would happen (if anything)...
 3 Graph (20 points) Use Demand and supply diagram and draw graphs to explain why the burden of tax falls more heavily on the side of the market that is less elastic.
Most questions answered within 3 hours.
-
IN PYTHON ONLY !! Program 2: Re-work
program #5 (WeeklyHours) from the previous assignment such that...
asked 14 minutes ago -
The average length of time between arrivals at a turnpike
toll-booth is 26 seconds. What is...
asked 1 hour ago -
(a) A piston at 6.1 atm contains a gas that occupies a volume of
3.5 L....
asked 3 hours ago -
Please answer true or false. Words
cannot be changed or added in to make it true...
asked 3 hours ago -
An empty test tube weighs 15.923 grams. Then,
MgCl2•6H2O is added into the test tube. After...
asked 3 hours ago -
Assume memory access is 10 units of time and disk access is
10000 units of time....
asked 3 hours ago -
1. Are all good samples random?
2. Magazines often report surveys giving statistics such as “63%...
asked 3 hours ago -
Under all the various types of market structures, firms
must eventually earn some economic profits for...
asked 3 hours ago -
Consider the following fitness regime for a single locus trait
with two co-dominant alleles: w11 =...
asked 3 hours ago -
A large cable company reports the following.
80% of its customers subscribe to its cable TV...
asked 3 hours ago -
Please answer the question in brief.
Discuss the role of ERP in organizations. Are ERP tools...
asked 3 hours ago -
Discuss the pros and cons of collaborative software such
as SameTime. Does it increase productivity? What...
asked 3 hours ago