This is a python matplotlib question. So it would be great if you could show me in python method.
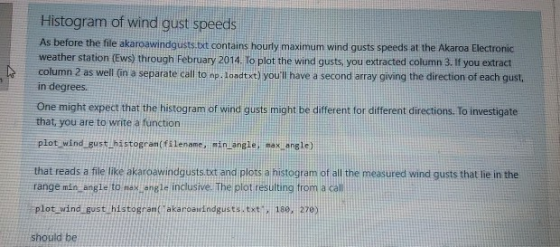
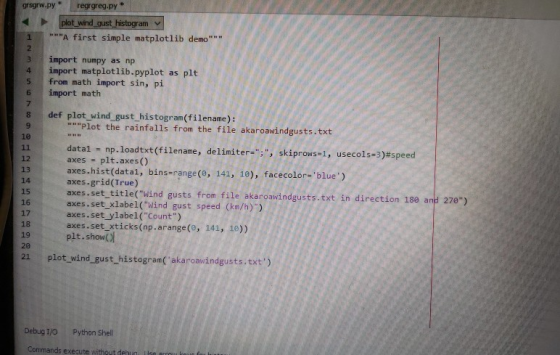
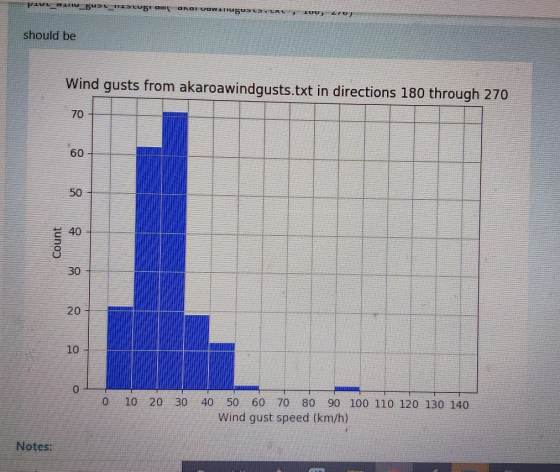
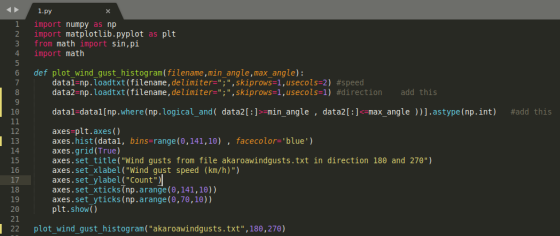
I have this loadtxt that asked to plot histogram of wind gusts(column 3) that lie in direction angle(column 2) from min angle to max angle inclusively. I don't know how to include min_angle and max_angle into my codes.
Homework Answers
import numpy as np
import matplotlib.pyplot as plt
from math import sin,pi
import math
def
plot_wind_gust_histogram(filename,min_angle,max_angle):
data1=np.loadtxt(filename,delimiter=";",skiprows=1,usecols=2)
#speed
data2=np.loadtxt(filename,delimiter=";",skiprows=1,usecols=1)
#direction add this
data1=data1[np.where(np.logical_and(
data2[:]>=min_angle , data2[:]<=max_angle
))].astype(np.int) #add this
axes=plt.axes()
axes.hist(data1, bins=range(0,141,10) ,
facecolor='blue')
axes.grid(True)
axes.set_title("Wind gusts from file
akaroawindgusts.txt in direction 180 and 270")
axes.set_xlabel("Wind gust speed (km/h)")
axes.set_ylabel("Count")
axes.set_xticks(np.arange(0,141,10))
axes.set_yticks(np.arange(0,70,10))
plt.show()
plot_wind_gust_histogram("akaroawindgusts.txt",180,270)
Add Answer to:
This is a python matplotlib question. So it would be
great if you could show me...
Most questions answered within 3 hours.
-
For the reaction CaI2+2AgNO3⟶2AgI+Ca(NO3)2 how many grams of
silver iodide, AgI, are produced from 56.5 g...
asked 9 minutes ago -
Write an equation for hydrolysis via acid catalysis.
Using ethyl acetate, ethyl benzoate, ethyl formate or...
asked 17 minutes ago -
Only one graph is needed.
(a) Draw a Supply Curve and the Demand Curve for the...
asked 20 minutes ago -
Fill in the blanks and please show how you arrived at numerical
answers
. The...
asked 20 minutes ago -
91. If the half – life of a sample of radioactive
material is 60 days, what...
asked 27 minutes ago -
White light (380nm-750nm) strikes a diffraction grating (420
lines/mm) at normal incidence. What is the highest-order...
asked 37 minutes ago -
1) Explain what is meant by a good being "excludable."?
2) Explain what is meant by...
asked 36 minutes ago -
I need help with this question:
Describe in detail at least two factors that stimulated American...
asked 44 minutes ago -
Calculate the Boyle temperature for helium assuming it follows
the Berthelot equation of state.
asked 44 minutes ago -
Summarize Strategic Corporate Social Responsibility, 4th edition
2017 book, chapter one and two.
asked 44 minutes ago -
1. If the standard deviations for return on stock A and stock B
are 28% and...
asked 59 minutes ago -
Please use python to explain.
Assume that the variables x and
y refer to strings. Write...
asked 1 hour ago