1. Based on the following information, construct a traditional financial institution balance sheet AND a balance...
Homework Answers
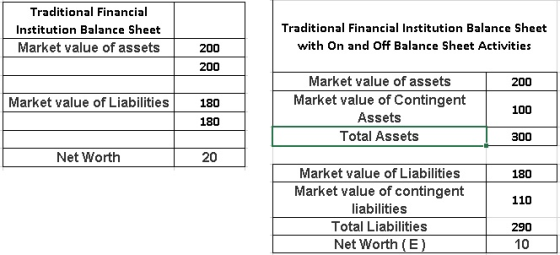
Traditional Financial Institution Balance Sheet: Net Worth (E)
= Market Value of Assets - Market Value of Liabilities
Traditional Financial Institution Balance Sheet with On and Off Balance Sheet Activities:
Net Worth (E) = (Market Value of Assets - Market Value of Liabilities) + ( Contingent Assets - Contingent Liabilities)
Add Answer to:
1. Based on the following information, construct a traditional
financial institution balance sheet AND a balance...
1 questions, 5 small parts A financial institution has the following market value balance sheet structure: Asset...
 1 questions, 5 small parts
A financial institution has the following market value balance sheet structure: Assets Cash Bond Liabilities and Equity $ 1,800 Certificate of deposit 1e, 200 Equity $12,000 Total liabilities and equity $10,800 1,200 $12,00 Total assets a. The bond has a 10-year maturity, a fixed-rate coupon of 11 percent paid at the end of each year, and a par value of $10.200. The certificate of deposit has a 1-year maturity and a 6 percent fixed rate...
1 questions, 5 small parts
A financial institution has the following market value balance sheet structure: Assets Cash Bond Liabilities and Equity $ 1,800 Certificate of deposit 1e, 200 Equity $12,000 Total liabilities and equity $10,800 1,200 $12,00 Total assets a. The bond has a 10-year maturity, a fixed-rate coupon of 11 percent paid at the end of each year, and a par value of $10.200. The certificate of deposit has a 1-year maturity and a 6 percent fixed rate...
1) Given the following financial information for 2014 and 2015, construct an Income Statement, Balance Sheet...
1) Given the following financial information for 2014 and 2015, construct an Income Statement, Balance Sheet and Statement of Cash Flows for Grand Twins. - The Income Statement information is for the entire year. - The Balance Sheet information is for December 31 of each year. 2014 2015 Accounts Payable $2,065,168 $3,732,362 Accounts Receivable 47,677,904 53,413,866 Cash 5,786,943 1,260,691 Common Stock 27,280,000 27,280,000 Cost of Goods Sold 45,014,348 50,298,751 Depreciation Expense 975,000 975,000...
You are a financial manager of a major U.S.-based financial institution of your choosing. Go to...
You are a financial manager of a major U.S.-based financial institution of your choosing. Go to the company's Web site (e.g., JPMorgan Chase, Wells Fargo, U.S. Bancorp). Pull its 2 most recent annual reports. In the annual report, you will see the balance sheet. You have been asked to provide a report to the company, in which you will include the following: Discuss major balance sheet numbers (e.g., Total Assets, Total Liabilities, Total Equity) and how these changed over the...
BALANCE SHEET ANALYSIS Complete the balance sheet and sales information using the following financial data: Total...
 BALANCE SHEET ANALYSIS
Complete the balance sheet and sales information using the
following financial data:
Total assets turnover: 1.2x
Days sales outstanding: 42 daysa
Inventory turnover ratio: 7x
Fixed assets turnover: 2.5x
Current ratio: 1.8x
Gross profit margin on sales: (Sales - Cost of goods sold)/Sales =
20%
aCalculation is based on a 365-day year. Do not round
intermediate calculations. Round your answer to the nearest
cent.
BALANCE SHEET ANALYSIS Complete the balance sheet and sales information using the following...
BALANCE SHEET ANALYSIS
Complete the balance sheet and sales information using the
following financial data:
Total assets turnover: 1.2x
Days sales outstanding: 42 daysa
Inventory turnover ratio: 7x
Fixed assets turnover: 2.5x
Current ratio: 1.8x
Gross profit margin on sales: (Sales - Cost of goods sold)/Sales =
20%
aCalculation is based on a 365-day year. Do not round
intermediate calculations. Round your answer to the nearest
cent.
BALANCE SHEET ANALYSIS Complete the balance sheet and sales information using the following...
2. Balance sheet The balance sheet provides a snapshot of the financial condition of a company....
2. Balance sheet The balance sheet provides a snapshot of the financial condition of a company. Investors and analysts use the information given on the balance sheet and other financial statements to make several interpretations regarding the company’s financial condition and performance. Blue Hamster Manufacturing Inc. is a hypothetical company. Suppose it has the following balance sheet items reported at the end of its first year of operation. For the second year, some parts are still incomplete. Use the information...
Balance Sheet Analysis Complete the balance sheet and sales information using the following financial data: Total...
 Balance Sheet Analysis Complete the balance sheet and sales information using the following financial data: Total assets turnover: 1.2x Days sales outstanding: 35.5 daysa Inventory turnover ratio: 5x Fixed assets turnover: 3x Current ratio: 1.8x Gross profit margin on sales: (Sales-Cost of goods sold)/Sales-2596 Calculation is based on a 365-day year. Round your answer to the nearest cent. Balance Sheet Cash Accounts receivable Inventories Fixed assets Current liabilities $ Long-term debt 33,750 Common stock Retained earnings Total liabilities and equity...
BALANCE SHEET ANALYSIS Complete the balance sheet and sales information using the following financial data: Total...
 BALANCE SHEET ANALYSIS Complete the balance sheet and sales information using the following financial data: Total assets turnover: 1.3x Days sales outstanding: 32 daysa Inventory turnover ratio: 7x Fixed assets turnover: 3x Current ratio: 2x Gross profit margin on sales: (Sales Cost of goods sold)/Sales = 30% Calculation is based on a 365-day year. Do not round intermediate calculations. Round your answer to the nearest cent. Balance Sheet Cash $ Current liabilities 81,250 Accounts receivable Long-term debt Common stock Inventories...
BALANCE SHEET ANALYSIS Complete the balance sheet and sales information using the following financial data: Total...
 BALANCE SHEET ANALYSIS Complete the balance sheet and sales information using the following financial data: Total assets turnover: 1x Days sales outstanding: 42.5 daysa Inventory turnover ratio: 3x Fixed assets turnover: 3x Current ratio: 2.3x Gross profit margin on sales: (Sales Cost of goods sold)/Sales 25% aCalculation is based on a 365-day year. Do not round intermediate calculations. Round your answer to the nearest cent. Balance Sheet Cash Current liabilities $ $ Accounts receivable Long-term debt 65,000 Common stock Inventories...
 1 questions, 5 small parts
A financial institution has the following market value balance sheet structure: Assets Cash Bond Liabilities and Equity $ 1,800 Certificate of deposit 1e, 200 Equity $12,000 Total liabilities and equity $10,800 1,200 $12,00 Total assets a. The bond has a 10-year maturity, a fixed-rate coupon of 11 percent paid at the end of each year, and a par value of $10.200. The certificate of deposit has a 1-year maturity and a 6 percent fixed rate...
1 questions, 5 small parts
A financial institution has the following market value balance sheet structure: Assets Cash Bond Liabilities and Equity $ 1,800 Certificate of deposit 1e, 200 Equity $12,000 Total liabilities and equity $10,800 1,200 $12,00 Total assets a. The bond has a 10-year maturity, a fixed-rate coupon of 11 percent paid at the end of each year, and a par value of $10.200. The certificate of deposit has a 1-year maturity and a 6 percent fixed rate...
 BALANCE SHEET ANALYSIS
Complete the balance sheet and sales information using the
following financial data:
Total assets turnover: 1.2x
Days sales outstanding: 42 daysa
Inventory turnover ratio: 7x
Fixed assets turnover: 2.5x
Current ratio: 1.8x
Gross profit margin on sales: (Sales - Cost of goods sold)/Sales =
20%
aCalculation is based on a 365-day year. Do not round
intermediate calculations. Round your answer to the nearest
cent.
BALANCE SHEET ANALYSIS Complete the balance sheet and sales information using the following...
BALANCE SHEET ANALYSIS
Complete the balance sheet and sales information using the
following financial data:
Total assets turnover: 1.2x
Days sales outstanding: 42 daysa
Inventory turnover ratio: 7x
Fixed assets turnover: 2.5x
Current ratio: 1.8x
Gross profit margin on sales: (Sales - Cost of goods sold)/Sales =
20%
aCalculation is based on a 365-day year. Do not round
intermediate calculations. Round your answer to the nearest
cent.
BALANCE SHEET ANALYSIS Complete the balance sheet and sales information using the following...
 Balance Sheet Analysis Complete the balance sheet and sales information using the following financial data: Total assets turnover: 1.2x Days sales outstanding: 35.5 daysa Inventory turnover ratio: 5x Fixed assets turnover: 3x Current ratio: 1.8x Gross profit margin on sales: (Sales-Cost of goods sold)/Sales-2596 Calculation is based on a 365-day year. Round your answer to the nearest cent. Balance Sheet Cash Accounts receivable Inventories Fixed assets Current liabilities $ Long-term debt 33,750 Common stock Retained earnings Total liabilities and equity...
 BALANCE SHEET ANALYSIS Complete the balance sheet and sales information using the following financial data: Total assets turnover: 1.3x Days sales outstanding: 32 daysa Inventory turnover ratio: 7x Fixed assets turnover: 3x Current ratio: 2x Gross profit margin on sales: (Sales Cost of goods sold)/Sales = 30% Calculation is based on a 365-day year. Do not round intermediate calculations. Round your answer to the nearest cent. Balance Sheet Cash $ Current liabilities 81,250 Accounts receivable Long-term debt Common stock Inventories...
 BALANCE SHEET ANALYSIS Complete the balance sheet and sales information using the following financial data: Total assets turnover: 1x Days sales outstanding: 42.5 daysa Inventory turnover ratio: 3x Fixed assets turnover: 3x Current ratio: 2.3x Gross profit margin on sales: (Sales Cost of goods sold)/Sales 25% aCalculation is based on a 365-day year. Do not round intermediate calculations. Round your answer to the nearest cent. Balance Sheet Cash Current liabilities $ $ Accounts receivable Long-term debt 65,000 Common stock Inventories...
Most questions answered within 3 hours.
-
Why has California been the favorite destination of large number
of secondary migrants?
asked 30 minutes ago -
Do not neglect the old for the new. The existing business must
not lose priority simply...
asked 3 hours ago -
Kylie is a single mom with two dependent children,
Tanner, age 7 and Olivia, age 11....
asked 4 hours ago -
Phosphorous + bromine = phosphorous tribromide. If 35.0 g of
bromine are reacted and 27.9 grams...
asked 6 hours ago -
Derive the long wavelength limit of the Planck energy density
distribution
asked 6 hours ago -
Calculate the pH of each of the following solutions.
0.50 M HBr
3.1×10⁻⁴ M KOH
4.2×10⁻⁵...
asked 9 hours ago -
For the year ended December 31, Depot Max’s cost of merchandise
sold was $85,600. Inventory at the...
asked 9 hours ago -
Week 10 - Professional Memo Assignment
Professional Memo Assignment
Your mission for this week, should you...
asked 9 hours ago -
Write a Python program that stores the data for each
player on the team, and it...
asked 10 hours ago -
In
the last 3 months, mike never knows when he is going to get his
allowance...
asked 10 hours ago -
Is Ca(OH)2 a Bronsted base, Lewis base, or both? Why?
asked 10 hours ago -
1A- Why don’t voters complain about U.S. tariffs on imported
sugar?
Because sugar is only a...
asked 10 hours ago