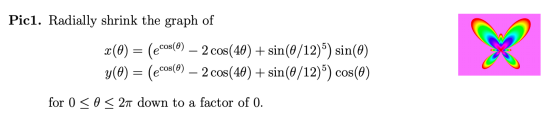
Use MatLAB to create a code to make the picture below.
Homework Answers
Hey,
I have prepared this MATLAB program to solve the question.
That will make the picture like above as output:
t = [0:0.01:(2*pi)] %timeplot for theta
y= (exp(cos(t)) - 2*cos(4*t) + sin((t/12).^5)).*sin(t);
x= (exp(cos(t)) - 2*cos(4*t) + sin((t/12).^5)).*cos(t);
c=t %for color variations
patch(y,x,c) %plotting with color
set(gca,'color',[1 0 1]) %setting background color
colorbar %show colorbar
Add Answer to:
Use MatLAB to create a code to make the picture below.
Pici. Radially shrink the graph...
In MATLAB create a code for An ellipsoid of revolution is the solid analog of a...
 In MATLAB create a code for
An ellipsoid of revolution is the solid analog of a two-dimensional ellipse. The equations for an ellipsoid of revolution rotated around the x axis are * = a cos o cos y = b cos sin e (8.22) 2 = b sin where a is radius along the x-axis and b is the radius along the y- and z-axes. Plot an ellipsoid of revolution for a = 2 and b = 1.
In MATLAB create a code for
An ellipsoid of revolution is the solid analog of a two-dimensional ellipse. The equations for an ellipsoid of revolution rotated around the x axis are * = a cos o cos y = b cos sin e (8.22) 2 = b sin where a is radius along the x-axis and b is the radius along the y- and z-axes. Plot an ellipsoid of revolution for a = 2 and b = 1.
Use matlab Answer 12-15 Have code to copy FUNCTIONAL DATA Create a vector of x values...
 Use
matlab
Answer 12-15
Have code to copy
FUNCTIONAL DATA Create a vector of x values from 0 to 207 with a spacing of 7/100, where y= x' sin (x) z= x'COS(x) 12. Create an x-y plot of x and y. 13. Create a polar plot of x and y. 14. Create a three-dimensional line plot of x, y, and z. Be sure to add a title and labels 15. Figure out how to adjust your input to plot3 in...
Use
matlab
Answer 12-15
Have code to copy
FUNCTIONAL DATA Create a vector of x values from 0 to 207 with a spacing of 7/100, where y= x' sin (x) z= x'COS(x) 12. Create an x-y plot of x and y. 13. Create a polar plot of x and y. 14. Create a three-dimensional line plot of x, y, and z. Be sure to add a title and labels 15. Figure out how to adjust your input to plot3 in...
Required: MATLAB CODE and attached figure window for the this question. 12. Make the plot of the astroid that is shown...
 Required: MATLAB CODE and attached figure window for the this
question.
12. Make the plot of the astroid that is shown in the is problem by using the parametric equa- 0.5 tion: 05 0s cos'() and y -sin'(t) for -x<T
12. Make the plot of the astroid that is shown in the is problem by using the parametric equa- 0.5 tion: 05 0s cos'() and y -sin'(t) for -x
Required: MATLAB CODE and attached figure window for the this
question.
12. Make the plot of the astroid that is shown in the is problem by using the parametric equa- 0.5 tion: 05 0s cos'() and y -sin'(t) for -x<T
12. Make the plot of the astroid that is shown in the is problem by using the parametric equa- 0.5 tion: 05 0s cos'() and y -sin'(t) for -x
Create a matlab program given the following numbers Paragraph Create a matlab code that compares college...
 Create a matlab program given the following numbers
Paragraph Create a matlab code that compares college football teams scores given the following table. Create a menu that allows the user to choose which two school's teams to compare, and then graph the two schools based on their two choices. Make sure the code will still be able to run even if the scores are changed in the table 2016 Avg Score 2017 Avg Score 2018 Avg Score School OU UT...
Create a matlab program given the following numbers
Paragraph Create a matlab code that compares college football teams scores given the following table. Create a menu that allows the user to choose which two school's teams to compare, and then graph the two schools based on their two choices. Make sure the code will still be able to run even if the scores are changed in the table 2016 Avg Score 2017 Avg Score 2018 Avg Score School OU UT...
Using Matlab; Please show written program to execute and instructions to create plot: 1. Create a...
Using Matlab; Please show written program to execute and instructions to create plot: 1. Create a vector of x values from 0 to 20 pi, with an increment of pi/100. y=x sin (x) and z= x cos (x) a) create a figure window with two subplots. In first subplot create an x versus y plot and in the second subplot create an y versus z plot. b) create a polar plot of x and y. Add title and labels to...
Using matlab, write the code and plot the graph for the following equations. The x axis...
 Using matlab, write the code and plot the graph for the
following equations. The x axis would be theta from 0 deg to 360
deg while the y axis would be angular or tangential position,
velocity and acceleration.
10 100 E7360 AB- eD100mm sin 1O-Sn 2To ne cose, t Cas 2 3 4 O,= To (reano,re bease-feo, sene-Feo 6 as ) Cos O2
10 100 E7360 AB- eD100mm sin 1O-Sn 2To ne cose, t Cas 2 3 4 O,= To...
Using matlab, write the code and plot the graph for the
following equations. The x axis would be theta from 0 deg to 360
deg while the y axis would be angular or tangential position,
velocity and acceleration.
10 100 E7360 AB- eD100mm sin 1O-Sn 2To ne cose, t Cas 2 3 4 O,= To (reano,re bease-feo, sene-Feo 6 as ) Cos O2
10 100 E7360 AB- eD100mm sin 1O-Sn 2To ne cose, t Cas 2 3 4 O,= To...
***Use MATLAB only*** Show all inputs and outputs Create the shape of an “apple” using a...
 ***Use MATLAB only***
Show all inputs and outputs
Create the shape of an “apple” using a surface plot, utilizing the following equations: x = cos u (4 +5.5 cos v) y = sin u (4 +5.5 cos v) z = (cos v + sin v – 1)(1+ sin vlog (1 + 7.5 sin v 10 Where 0 Sus 21 and - SV ST, use Au = Av =1/32. Title: Apple, X-label: x, Y-label y, Z-label: πν.
***Use MATLAB only***
Show all inputs and outputs
Create the shape of an “apple” using a surface plot, utilizing the following equations: x = cos u (4 +5.5 cos v) y = sin u (4 +5.5 cos v) z = (cos v + sin v – 1)(1+ sin vlog (1 + 7.5 sin v 10 Where 0 Sus 21 and - SV ST, use Au = Av =1/32. Title: Apple, X-label: x, Y-label y, Z-label: πν.
Don't use fplot command. Matlab code. Write out code please, don't make it a screenshot. 2....
 Don't use fplot command. Matlab code. Write out code please,
don't make it a screenshot.
2. Use the subplot command to make two plots of the function f(x) = (x + 1)(x - 2)(2x – 0.25) - et one graph for 0 < x <3 and the other for 3 < x < 6. Use a logarithmic scale for the y-axis. Include a plot title (for each subplot), and label both aris(for each subplot).
Don't use fplot command. Matlab code. Write out code please,
don't make it a screenshot.
2. Use the subplot command to make two plots of the function f(x) = (x + 1)(x - 2)(2x – 0.25) - et one graph for 0 < x <3 and the other for 3 < x < 6. Use a logarithmic scale for the y-axis. Include a plot title (for each subplot), and label both aris(for each subplot).
Please help me with this matlab problem, the answer should look like the picture below. Thank...
 Please help me with this matlab problem, the answer should
look like the picture below. Thank you
%1 Write an anonymous function that will receive data in the form of a plot function handle, x and y vectors, and a handle to a plot function and wil1 produce the plot. For example, a call to the function would look like the following: myPlot (@bar,x,y). x -pǐ : 0.25 : pi; y sin(x); % Piave you anonymous funcyion code here subplot...
Please help me with this matlab problem, the answer should
look like the picture below. Thank you
%1 Write an anonymous function that will receive data in the form of a plot function handle, x and y vectors, and a handle to a plot function and wil1 produce the plot. For example, a call to the function would look like the following: myPlot (@bar,x,y). x -pǐ : 0.25 : pi; y sin(x); % Piave you anonymous funcyion code here subplot...
MATLAB, please provide code script Objective: Create a function file that animates projectile motion defined by...
 MATLAB,
please provide code script
Objective: Create a function file that animates projectile motion defined by the following equations in a subplot. Your function should accept user inputs of launch speed and launch angle. The output of your function will be a top subplot that displays height (y) as a function of x. The bottom subplot should display the vertical velocity while the projectile is in motion. A video of what your animation should look like is posted with this...
MATLAB,
please provide code script
Objective: Create a function file that animates projectile motion defined by the following equations in a subplot. Your function should accept user inputs of launch speed and launch angle. The output of your function will be a top subplot that displays height (y) as a function of x. The bottom subplot should display the vertical velocity while the projectile is in motion. A video of what your animation should look like is posted with this...
 In MATLAB create a code for
An ellipsoid of revolution is the solid analog of a two-dimensional ellipse. The equations for an ellipsoid of revolution rotated around the x axis are * = a cos o cos y = b cos sin e (8.22) 2 = b sin where a is radius along the x-axis and b is the radius along the y- and z-axes. Plot an ellipsoid of revolution for a = 2 and b = 1.
In MATLAB create a code for
An ellipsoid of revolution is the solid analog of a two-dimensional ellipse. The equations for an ellipsoid of revolution rotated around the x axis are * = a cos o cos y = b cos sin e (8.22) 2 = b sin where a is radius along the x-axis and b is the radius along the y- and z-axes. Plot an ellipsoid of revolution for a = 2 and b = 1.
 Use
matlab
Answer 12-15
Have code to copy
FUNCTIONAL DATA Create a vector of x values from 0 to 207 with a spacing of 7/100, where y= x' sin (x) z= x'COS(x) 12. Create an x-y plot of x and y. 13. Create a polar plot of x and y. 14. Create a three-dimensional line plot of x, y, and z. Be sure to add a title and labels 15. Figure out how to adjust your input to plot3 in...
Use
matlab
Answer 12-15
Have code to copy
FUNCTIONAL DATA Create a vector of x values from 0 to 207 with a spacing of 7/100, where y= x' sin (x) z= x'COS(x) 12. Create an x-y plot of x and y. 13. Create a polar plot of x and y. 14. Create a three-dimensional line plot of x, y, and z. Be sure to add a title and labels 15. Figure out how to adjust your input to plot3 in...
 Required: MATLAB CODE and attached figure window for the this
question.
12. Make the plot of the astroid that is shown in the is problem by using the parametric equa- 0.5 tion: 05 0s cos'() and y -sin'(t) for -x<T
12. Make the plot of the astroid that is shown in the is problem by using the parametric equa- 0.5 tion: 05 0s cos'() and y -sin'(t) for -x
Required: MATLAB CODE and attached figure window for the this
question.
12. Make the plot of the astroid that is shown in the is problem by using the parametric equa- 0.5 tion: 05 0s cos'() and y -sin'(t) for -x<T
12. Make the plot of the astroid that is shown in the is problem by using the parametric equa- 0.5 tion: 05 0s cos'() and y -sin'(t) for -x
 Create a matlab program given the following numbers
Paragraph Create a matlab code that compares college football teams scores given the following table. Create a menu that allows the user to choose which two school's teams to compare, and then graph the two schools based on their two choices. Make sure the code will still be able to run even if the scores are changed in the table 2016 Avg Score 2017 Avg Score 2018 Avg Score School OU UT...
Create a matlab program given the following numbers
Paragraph Create a matlab code that compares college football teams scores given the following table. Create a menu that allows the user to choose which two school's teams to compare, and then graph the two schools based on their two choices. Make sure the code will still be able to run even if the scores are changed in the table 2016 Avg Score 2017 Avg Score 2018 Avg Score School OU UT...
 Using matlab, write the code and plot the graph for the
following equations. The x axis would be theta from 0 deg to 360
deg while the y axis would be angular or tangential position,
velocity and acceleration.
10 100 E7360 AB- eD100mm sin 1O-Sn 2To ne cose, t Cas 2 3 4 O,= To (reano,re bease-feo, sene-Feo 6 as ) Cos O2
10 100 E7360 AB- eD100mm sin 1O-Sn 2To ne cose, t Cas 2 3 4 O,= To...
Using matlab, write the code and plot the graph for the
following equations. The x axis would be theta from 0 deg to 360
deg while the y axis would be angular or tangential position,
velocity and acceleration.
10 100 E7360 AB- eD100mm sin 1O-Sn 2To ne cose, t Cas 2 3 4 O,= To (reano,re bease-feo, sene-Feo 6 as ) Cos O2
10 100 E7360 AB- eD100mm sin 1O-Sn 2To ne cose, t Cas 2 3 4 O,= To...
 ***Use MATLAB only***
Show all inputs and outputs
Create the shape of an “apple” using a surface plot, utilizing the following equations: x = cos u (4 +5.5 cos v) y = sin u (4 +5.5 cos v) z = (cos v + sin v – 1)(1+ sin vlog (1 + 7.5 sin v 10 Where 0 Sus 21 and - SV ST, use Au = Av =1/32. Title: Apple, X-label: x, Y-label y, Z-label: πν.
***Use MATLAB only***
Show all inputs and outputs
Create the shape of an “apple” using a surface plot, utilizing the following equations: x = cos u (4 +5.5 cos v) y = sin u (4 +5.5 cos v) z = (cos v + sin v – 1)(1+ sin vlog (1 + 7.5 sin v 10 Where 0 Sus 21 and - SV ST, use Au = Av =1/32. Title: Apple, X-label: x, Y-label y, Z-label: πν.
 Don't use fplot command. Matlab code. Write out code please,
don't make it a screenshot.
2. Use the subplot command to make two plots of the function f(x) = (x + 1)(x - 2)(2x – 0.25) - et one graph for 0 < x <3 and the other for 3 < x < 6. Use a logarithmic scale for the y-axis. Include a plot title (for each subplot), and label both aris(for each subplot).
Don't use fplot command. Matlab code. Write out code please,
don't make it a screenshot.
2. Use the subplot command to make two plots of the function f(x) = (x + 1)(x - 2)(2x – 0.25) - et one graph for 0 < x <3 and the other for 3 < x < 6. Use a logarithmic scale for the y-axis. Include a plot title (for each subplot), and label both aris(for each subplot).
 Please help me with this matlab problem, the answer should
look like the picture below. Thank you
%1 Write an anonymous function that will receive data in the form of a plot function handle, x and y vectors, and a handle to a plot function and wil1 produce the plot. For example, a call to the function would look like the following: myPlot (@bar,x,y). x -pǐ : 0.25 : pi; y sin(x); % Piave you anonymous funcyion code here subplot...
Please help me with this matlab problem, the answer should
look like the picture below. Thank you
%1 Write an anonymous function that will receive data in the form of a plot function handle, x and y vectors, and a handle to a plot function and wil1 produce the plot. For example, a call to the function would look like the following: myPlot (@bar,x,y). x -pǐ : 0.25 : pi; y sin(x); % Piave you anonymous funcyion code here subplot...
 MATLAB,
please provide code script
Objective: Create a function file that animates projectile motion defined by the following equations in a subplot. Your function should accept user inputs of launch speed and launch angle. The output of your function will be a top subplot that displays height (y) as a function of x. The bottom subplot should display the vertical velocity while the projectile is in motion. A video of what your animation should look like is posted with this...
MATLAB,
please provide code script
Objective: Create a function file that animates projectile motion defined by the following equations in a subplot. Your function should accept user inputs of launch speed and launch angle. The output of your function will be a top subplot that displays height (y) as a function of x. The bottom subplot should display the vertical velocity while the projectile is in motion. A video of what your animation should look like is posted with this...
Most questions answered within 3 hours.
-
Cynaide is a deadly poison that blocks the last step in the
electron transport chain of...
asked 1 minute ago -
Your friend tells you that there is a vending machine on campus
that dispenses M&M packs...
asked 16 minutes ago -
What advantages are there to using piperidine rather than
hydroxide as a base?
asked 15 minutes ago -
7. The life of a Freeze Breeze electric fan is normally
distributed with a mean 4...
asked 18 minutes ago -
1. A 751 mL NaCl solution is diluted to a volume of 1.06 L and a...
asked 23 minutes ago -
8
A $20,000 face value STRIPS is currently quoted at 38.642 and
has 8 years to...
asked 23 minutes ago -
The current exchange rate between the Japanese yen and
the US dollar is 120 yen per...
asked 25 minutes ago -
Marla’s Massages and More bought a special massage table two
years ago for $9,300. At the...
asked 32 minutes ago -
Suppose you require a peak output voltage of 15.0 V and have
available an AC source...
asked 32 minutes ago -
We
conduct A study to estimate the mean age of the population of women
at the...
asked 44 minutes ago -
.13 : Assume that we make an enhancement to a computer that
improves some mode of...
asked 45 minutes ago -
4)
Find the tension in an elevator cable if the 1000 kg elevator is
descending with...
asked 51 minutes ago