NOTE: PLEASE GIVE YOUR ANSWER IN DETAILED EXPLANATIONS AS MUCH AS POSSIBLE. AND PLEASE LEGIBLE STEPS,...
NOTE: PLEASE GIVE YOUR ANSWER IN DETAILED EXPLANATIONS AS MUCH AS POSSIBLE. AND PLEASE LEGIBLE STEPS, THANK YOU.

QUESTION 1 - Given the numbers below, describe the contents of the set, E, of the graph G=(V,E), that represents the binary search tree (unbalanced) created by adding each element, one by one, from left to right.

77, 27, 89, 32, 93, 43, 46, 51, 63, 69

Your answer:
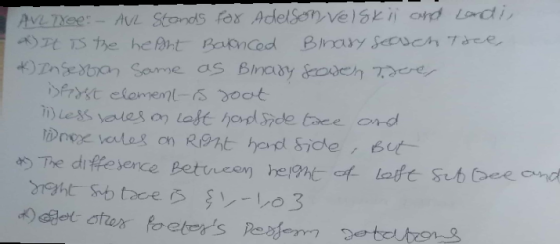
QUESTION 2 - Given the numbers below, describe the contents of the set, E, of the graph G=(V,E), and the root node, that represents the AVL tree created by adding each element, one by one, from left to right.
77, 27, 89, 32, 93, 43, 46, 51, 63, 69
Your answer:
Homework Answers


Anything doubtful or not understand just comment I will touch with you. Please thumsup for my effort thank you and all the best
Add Answer to:
NOTE: PLEASE GIVE YOUR ANSWER IN DETAILED EXPLANATIONS AS MUCH AS POSSIBLE. AND PLEASE LEGIBLE STEPS,...
(10 pts) Given the values below, describe the contents of the set, E, of the graph...
(10 pts) Given the values below, describe the contents of the set, E, of the graph G=(V,E), that represents the binary search tree (unbalanced) created by adding each value, one by one, from left to right. values: R, E, D, B, O, A, T
Consider the below matrixA, which you can copy and paste directly into Matlab.
Problem #1: Consider the below matrix A, which you can copy and paste directly into Matlab. The matrix contains 3 columns. The first column consists of Test #1 marks, the second column is Test # 2 marks, and the third column is final exam marks for a large linear algebra course. Each row represents a particular student.A = [36 45 75 81 59 73 77 73 73 65 72 78 65 55 83 73 57 78 84 31 60 83...
Please answer all questions! thanks :) VI/ Test scores from a math midterm are as follows:...
 Please
answer all questions! thanks :)
VI/ Test scores from a math midterm are as follows: 79, 90, 85, 89, 70, 59, 75, 64, 83, 78, 75, 77, 78, 77, 67, 85, 74, 52, 87, 72, 69, 76, 61, 77, 93, 86, 79, 90, 74, 67, 51, 75, 77, 82, 78, 60, 86, 72, 91, 95, 82 Complete the frequency distribution table to include all data a. Class Tallies Class Midpoint Relative Cumulative Frequency relative freq boundaries Frequency 51 57...
Please
answer all questions! thanks :)
VI/ Test scores from a math midterm are as follows: 79, 90, 85, 89, 70, 59, 75, 64, 83, 78, 75, 77, 78, 77, 67, 85, 74, 52, 87, 72, 69, 76, 61, 77, 93, 86, 79, 90, 74, 67, 51, 75, 77, 82, 78, 60, 86, 72, 91, 95, 82 Complete the frequency distribution table to include all data a. Class Tallies Class Midpoint Relative Cumulative Frequency relative freq boundaries Frequency 51 57...
Please show how you did this in excel. :13-19 Every home football game for the past...
 Please show how you did this in excel.
:13-19 Every home football game for the past eight years at Eastern State University has been sold out. The revenues from ticket sales are significant, but the sale of food, beverages, and souvenirs has contrib- uted greatly to the overall profitability of the football program. One particular souvenir is the football pro- gram for each game. The number of programs sold at each game is described by the following probabil- ity distribution:...
Please show how you did this in excel.
:13-19 Every home football game for the past eight years at Eastern State University has been sold out. The revenues from ticket sales are significant, but the sale of food, beverages, and souvenirs has contrib- uted greatly to the overall profitability of the football program. One particular souvenir is the football pro- gram for each game. The number of programs sold at each game is described by the following probabil- ity distribution:...
1. Forecast demand for Year 4. a. Explain what technique you utilized to forecast your demand....
 1. Forecast demand for Year 4.
a. Explain what technique you utilized to forecast your
demand.
b. Explain why you chose this technique over others.
Year 3 Year 1 Year 2 Actual Actual Actual Forecast Forecast Forecast Demand Demand Demand Week 1 52 57 63 55 66 77 Week 2 49 58 68 69 75 65 Week 3 47 50 58 65 80 74 Week 4 60 53 58 55 78 67 57 Week 5 49 57 64 76 77...
1. Forecast demand for Year 4.
a. Explain what technique you utilized to forecast your
demand.
b. Explain why you chose this technique over others.
Year 3 Year 1 Year 2 Actual Actual Actual Forecast Forecast Forecast Demand Demand Demand Week 1 52 57 63 55 66 77 Week 2 49 58 68 69 75 65 Week 3 47 50 58 65 80 74 Week 4 60 53 58 55 78 67 57 Week 5 49 57 64 76 77...
The INORDER traversal output of a binary tree is U,N,I,V,E,R,S,I,T,Y and the POSTORDER traversal output of the same tree is N,U,V,R,E,T,I,S,I,Y
a. The INORDER traversal output of a binary tree is U,N,I,V,E,R,S,I,T,Y and the POSTORDER traversal output of the same tree is N,U,V,R,E,T,I,S,I,Y. Construct the tree and determine the output of the PREORDER traversal output. b. One main difference between a binary search tree (BST) and an AVL (Adelson-Velski and Landis) tree is that an AVL tree has a balance condition, that is, for every node in the AVL tree, the height of the left and right subtrees differ by at most 1....
Write a python nested for loop that prints out the following pattern 100 99 98 97...
Write a python nested for loop that prints out the following pattern 100 99 98 97 96 95 94 93 92 91 90 89 88 87 86 85 84 83 82 81 80 79 78 77 76 75 74 73 72 71 70 69 68 67 66 65 64 63 62 61 60 59 58 57 56 55 54 53 52 51 50 49 48 47 46 45 44 43 42 41 40 39 38 37 36 35 34 33...
The ExceptionLab class provided: – Creates an array of 100 elements and fills it with random...
 The ExceptionLab class provided: – Creates an array of 100
elements and fills it with random numbers from 1 to 100. – It asks
the user for an index value between 0 and 99. – Prints the element
at that position. – If a number > 99 is entered by the user, the
class will abort with an ArrayIndexOutOfBoundsException • Modify
the ExceptionLab: – Add a try-catch clause which intercepts the
ArrayIndexOutOfBounds and prints the message: Index value cannot be...
The ExceptionLab class provided: – Creates an array of 100
elements and fills it with random numbers from 1 to 100. – It asks
the user for an index value between 0 and 99. – Prints the element
at that position. – If a number > 99 is entered by the user, the
class will abort with an ArrayIndexOutOfBoundsException • Modify
the ExceptionLab: – Add a try-catch clause which intercepts the
ArrayIndexOutOfBounds and prints the message: Index value cannot be...
Use C++ (2D Array) Write a program which: 1. Assigns data given below into the 2D...
Use C++ (2D Array) Write a program which: 1. Assigns data given below into the 2D array of integers which is 10x10. 2. Prints out the contents of the 2D array after assigning the data to make sure correct data was assigned. 3. Figures out and prints out the square root of the sum of ALL the elements in the 2D array. 4. Figures out and prints out the average of ALL THE ELEMENTS in the 2D array. 5. Figures...
I literally have no idea what I’m doing. Help!!! Please show work!! Write an essay using...
 I literally have no idea what I’m doing. Help!!! Please show
work!!
Write an essay using Word and post it as an attachment to the discussion. Cover the following points. Choose a data set from Stat Disk using one of the following files from 13th Edition Elementary Statistics: Oscar Winner Freshman 15 Word Count Garbage Weights Passive and Active Smoke If the file contains more than one variable, choose a quantitative variable. Create a histogram using your chosen variable and...
I literally have no idea what I’m doing. Help!!! Please show
work!!
Write an essay using Word and post it as an attachment to the discussion. Cover the following points. Choose a data set from Stat Disk using one of the following files from 13th Edition Elementary Statistics: Oscar Winner Freshman 15 Word Count Garbage Weights Passive and Active Smoke If the file contains more than one variable, choose a quantitative variable. Create a histogram using your chosen variable and...
 Please
answer all questions! thanks :)
VI/ Test scores from a math midterm are as follows: 79, 90, 85, 89, 70, 59, 75, 64, 83, 78, 75, 77, 78, 77, 67, 85, 74, 52, 87, 72, 69, 76, 61, 77, 93, 86, 79, 90, 74, 67, 51, 75, 77, 82, 78, 60, 86, 72, 91, 95, 82 Complete the frequency distribution table to include all data a. Class Tallies Class Midpoint Relative Cumulative Frequency relative freq boundaries Frequency 51 57...
Please
answer all questions! thanks :)
VI/ Test scores from a math midterm are as follows: 79, 90, 85, 89, 70, 59, 75, 64, 83, 78, 75, 77, 78, 77, 67, 85, 74, 52, 87, 72, 69, 76, 61, 77, 93, 86, 79, 90, 74, 67, 51, 75, 77, 82, 78, 60, 86, 72, 91, 95, 82 Complete the frequency distribution table to include all data a. Class Tallies Class Midpoint Relative Cumulative Frequency relative freq boundaries Frequency 51 57...
 Please show how you did this in excel.
:13-19 Every home football game for the past eight years at Eastern State University has been sold out. The revenues from ticket sales are significant, but the sale of food, beverages, and souvenirs has contrib- uted greatly to the overall profitability of the football program. One particular souvenir is the football pro- gram for each game. The number of programs sold at each game is described by the following probabil- ity distribution:...
Please show how you did this in excel.
:13-19 Every home football game for the past eight years at Eastern State University has been sold out. The revenues from ticket sales are significant, but the sale of food, beverages, and souvenirs has contrib- uted greatly to the overall profitability of the football program. One particular souvenir is the football pro- gram for each game. The number of programs sold at each game is described by the following probabil- ity distribution:...
 1. Forecast demand for Year 4.
a. Explain what technique you utilized to forecast your
demand.
b. Explain why you chose this technique over others.
Year 3 Year 1 Year 2 Actual Actual Actual Forecast Forecast Forecast Demand Demand Demand Week 1 52 57 63 55 66 77 Week 2 49 58 68 69 75 65 Week 3 47 50 58 65 80 74 Week 4 60 53 58 55 78 67 57 Week 5 49 57 64 76 77...
1. Forecast demand for Year 4.
a. Explain what technique you utilized to forecast your
demand.
b. Explain why you chose this technique over others.
Year 3 Year 1 Year 2 Actual Actual Actual Forecast Forecast Forecast Demand Demand Demand Week 1 52 57 63 55 66 77 Week 2 49 58 68 69 75 65 Week 3 47 50 58 65 80 74 Week 4 60 53 58 55 78 67 57 Week 5 49 57 64 76 77...
 The ExceptionLab class provided: – Creates an array of 100
elements and fills it with random numbers from 1 to 100. – It asks
the user for an index value between 0 and 99. – Prints the element
at that position. – If a number > 99 is entered by the user, the
class will abort with an ArrayIndexOutOfBoundsException • Modify
the ExceptionLab: – Add a try-catch clause which intercepts the
ArrayIndexOutOfBounds and prints the message: Index value cannot be...
The ExceptionLab class provided: – Creates an array of 100
elements and fills it with random numbers from 1 to 100. – It asks
the user for an index value between 0 and 99. – Prints the element
at that position. – If a number > 99 is entered by the user, the
class will abort with an ArrayIndexOutOfBoundsException • Modify
the ExceptionLab: – Add a try-catch clause which intercepts the
ArrayIndexOutOfBounds and prints the message: Index value cannot be...
 I literally have no idea what I’m doing. Help!!! Please show
work!!
Write an essay using Word and post it as an attachment to the discussion. Cover the following points. Choose a data set from Stat Disk using one of the following files from 13th Edition Elementary Statistics: Oscar Winner Freshman 15 Word Count Garbage Weights Passive and Active Smoke If the file contains more than one variable, choose a quantitative variable. Create a histogram using your chosen variable and...
I literally have no idea what I’m doing. Help!!! Please show
work!!
Write an essay using Word and post it as an attachment to the discussion. Cover the following points. Choose a data set from Stat Disk using one of the following files from 13th Edition Elementary Statistics: Oscar Winner Freshman 15 Word Count Garbage Weights Passive and Active Smoke If the file contains more than one variable, choose a quantitative variable. Create a histogram using your chosen variable and...
Most questions answered within 3 hours.
-
Combustion of hydrocarbons such as ethane ( C 2 H 6 ) produces
carbon dioxide, a...
asked 39 seconds ago -
For the reaction: 2A + 3B ---> 3D, if the rate of formation
of D is...
asked 58 seconds ago -
At 25 °C, a solution has a hydronium ion concentration of
2.70×10⁻⁸ M.
What is the...
asked 16 minutes ago -
If gatsby wants to ensure that it can start each month with
sufficient denim on hand...
asked 13 minutes ago -
CISC 1115 Assignment 6 Write a complete program, including
javadoc comments, to process voter statistics Input...
asked 1 hour ago -
Use De Broglie's wave equation to calculate the wavelength of an
electron moving at the speed...
asked 37 minutes ago -
SargentMud Corporation makes custom mud sculptures and is very
labor intensive so they apply overhead cost...
asked 26 minutes ago -
If the Henry’s law constant for oxygen in water is 1.3 x 10⁻³
M/atm at 25...
asked 1 hour ago -
A laser with a wavelength of 470. nm illuminates two narrow
slits. The interference pattern from...
asked 53 minutes ago -
1) In your own words, explain what elasticity of supply is
signifying. (Put in your own...
asked 44 minutes ago -
Who is ultimately responsible for formulating a firm's strategy
-- its managers, employees, or both? Explain.
asked 35 minutes ago -
The risk of material misstatement due to fraud relating to
revenue recognition should be a. given...
asked 49 minutes ago