The U.S. Geological Survey compiled historical data about Old Faithful Geyser (Yellowstone National Park) from 1870...
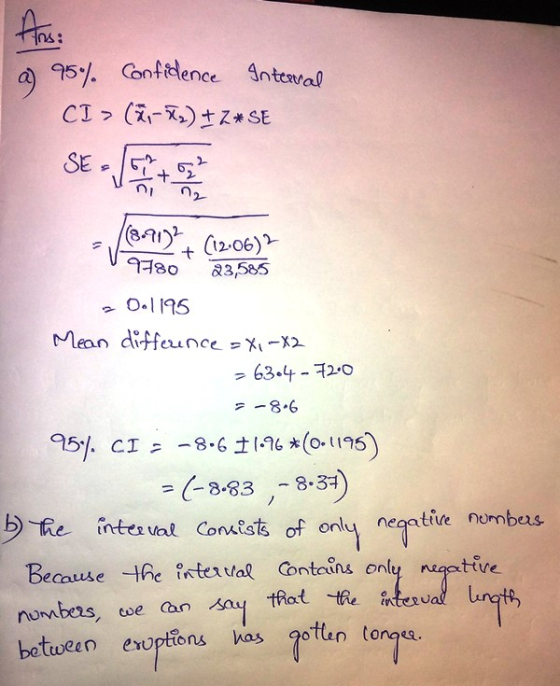
The U.S. Geological Survey compiled historical data about Old Faithful Geyser (Yellowstone National Park) from 1870 to 1987. Let x1 be a random variable that represents the time interval (in minutes) between Old Faithful eruptions for the years 1948 to 1952. Based on 9780 observations, the sample mean interval was x1 = 63.4 minutes. Let x2 be a random variable that represents the time interval in minutes between Old Faithful eruptions for the years 1983 to 1987. Based on 23,585 observations, the sample mean time interval was x2 = 72.0 minutes. Historical data suggest that σ1 = 8.91 minutes and σ2 = 12.06 minutes. Let μ1 be the population mean of x1 and let μ2 be the population mean of x2.
(a) Compute a 95% confidence interval for μ1 – μ2. (Use 2 decimal places.)lower limit upper limit (b) Comment on the meaning of the confidence interval in the context of this problem. Does the interval consist of positive numbers only? negative numbers only? a mix of positive and negative numbers? Does it appear (at the 95% confidence level) that a change in the interval length between eruptions has occurred? Many geologic experts believe that the distribution of eruption times of Old Faithful changed after the major earthquake that occurred in 1959.
Because the interval contains only positive numbers,
we can say that the interval length between eruptions has gotten
shorter.Because the interval contains both positive and negative
numbers, we can not say that the interval length between eruptions
has gotten longer. We can not make any
conclusions using this confidence interval.Because the interval
contains only negative numbers, we can say that the interval length
between eruptions has gotten longer.
Homework Answers
Add Answer to:
The U.S. Geological Survey compiled historical data
about Old Faithful Geyser (Yellowstone National Park) from 1870...
The U.S. Geological Survey compiled historical data about Old Faithful Geyser (Yellowstone National Park) from 1870...
The U.S. Geological Survey compiled historical data about Old Faithful Geyser (Yellowstone National Park) from 1870 to 1987. Let x1 be a random variable that represents the time interval (in minutes) between Old Faithful eruptions for the years 1948 to 1952. Based on 9160 observations, the sample mean interval was x1 = 62.8 minutes. Let x2 be a random variable that represents the time interval in minutes between Old Faithful eruptions for the years 1983 to 1987. Based on 25,457...
3. The U.S. Geological Survey compiled historical data about Old Faithful Geyser (Yellowstone National Park) from...
3. The U.S. Geological Survey compiled historical data about Old Faithful Geyser (Yellowstone National Park) from 1870 to 1987. Let x1 be a random variable that represents the time interval (in minutes) between Old Faithful eruptions for the years 1948 to 1952. Based on 9,800 observations, the sample mean interval was 62.6 minutes. Let x2 be a random variable that represents the time interval in minutes between Old Faithful eruptions for the years 1983 to 1987. Based on 24,404 observations,...
It is estimated that Old Faithful geyser in Yellowstone National Park erupts every 90 minutes. One...
It is estimated that Old Faithful geyser in Yellowstone National Park erupts every 90 minutes. One day was selected at random and the times of Old Faithful’s eruptions were recorded. The number of minutes between eruptions is recorded below. Can you conclude that the mean time between eruptions differs from 90 minutes? The number of minutes between eruptions are: 93, 94, 91, 88, 99, 89, 94, 96, 76, 109, 94, 96, 91, 98, 96 What is the test value? Round...
8. You and several friends visit the Old Faithful geyser in Yellowstone National Park. You record...
 8. You and several friends visit the Old Faithful geyser in Yellowstone National Park. You record the interval times between eruptions in minutes. You get the following data. 81 81 86 87 89 92 93 94 95 96 97 98 98 10 10 106 a. How many interval times were recorded? b. What is the mean interval time? Round your answer to two decimal places. c. What is the median interval time? d. Identify the 5-number summary for this data....
A random sample of 24 wolf litters in Ontario, Canada, gave an average of x1 =...
A random sample of 24 wolf litters in Ontario, Canada, gave an average of x1 = 4.4 wolf pups per litter, with estimated sample standard deviation s1 = 1.0. Another random sample of 11 wolf litters in Finland gave an average of x2 = 2.8 wolf pups per litter, with sample standard deviation s2 = 1.3. (a) Categorize the problem below according to parameter being estimated, proportion p, mean μ, difference of means μ1 – μ2, or difference of proportions...
Independent random samples of professional football and basketball players gave the following information. Assume that the...
Independent random samples of professional football and basketball players gave the following information. Assume that the weight distributions are mound-shaped and symmetric. Weights (in lb) of pro football players: x1; n1 = 21 249 261 254 251 244 276 240 265 257 252 282 256 250 264 270 275 245 275 253 265 270 Weights (in lb) of pro basketball players: x2; n2 = 19 203 200 220 210 192 215 222 216 228 207 225 208 195 191 207...
Question 7 Independent random samples from two regions in the same area gave the following chemical...
 Question 7 Independent random samples from two regions in the same area gave the following chemical measurements (ppm). Assume the popalation distributions of the chemical are mound-shaped and symmetric for these two regions Region 1,71; m1 = 12 981 726 686 496 657 627 815 504 950 605 570 520 Region I: x2 2-16 024 830 526 502 539 373 888 685 868 1093 1132 792 1081 722 1092 844 LotMg-678 be the population mean and ơ1.164 be the population...
Question 7 Not yet anowered Points out of 7.00 g qestion Independent random samples from two...
 Question 7 Not yet anowered Points out of 7.00 g qestion Independent random samples from two regions in the same area gave the following chemical measurements (ppm). Assume the population distributions of the chemical are mound-shaped and symmetric two regions for these Region I: 1-12 981 726 686 496 657 627 815 504 950 605 570 520 Region 11: 2-16 1024 830 526 502 539 373 888 685 868 1093 1132 792 1081 722 1092 844 Let μ1-678 be the...
The following are 30 time lapses in minutes between eruptions of Old Faithful geyser in Yellowstone National Park, recorded between the hours of 8 a.m. and 10 p.m. on a certain day, and measured from...
The following are 30 time lapses in minutes between eruptions of Old Faithful geyser in Yellowstone National Park, recorded between the hours of 8 a.m. and 10 p.m. on a certain day, and measured from the beginning of one eruption to the beginning of the next: 68, 63, 66, 63, 61, 44, 60, 62, 71, 62, 62, 55, 62, 67, 73, 72, 55, 67, 68, 65, 60, 61, 71, 60, 68, 67, 72, 69, 65, 66 A researcher wants to...
Independent random samples of professional foctball and basketball players gave the following inf...
 Independent random samples of professional foctball and basketball players gave the following information. Heights (In ft) of pro football players: x1i n1 45 6.35 6.52 6.50 6.25 6.50 6.33 6.25 6.17 6.42 6.33 6.42 6.58 6.08 6.58 6.50 6.42 6.25 6.07 5.01 G.OD 6.50 5.83 5.91 5.67 6.0D .0B 6.17 6.58 6.50 6.25 Hcights (in ft) of pro basketball players: x2i n2 40 6.05 6.5S5 6.25 6.5 6.25 5.92 7.00 641 6.75 6.25 .00 6.92 6.83 6.5 .41 6.07 6.07...
 8. You and several friends visit the Old Faithful geyser in Yellowstone National Park. You record the interval times between eruptions in minutes. You get the following data. 81 81 86 87 89 92 93 94 95 96 97 98 98 10 10 106 a. How many interval times were recorded? b. What is the mean interval time? Round your answer to two decimal places. c. What is the median interval time? d. Identify the 5-number summary for this data....
 Question 7 Independent random samples from two regions in the same area gave the following chemical measurements (ppm). Assume the popalation distributions of the chemical are mound-shaped and symmetric for these two regions Region 1,71; m1 = 12 981 726 686 496 657 627 815 504 950 605 570 520 Region I: x2 2-16 024 830 526 502 539 373 888 685 868 1093 1132 792 1081 722 1092 844 LotMg-678 be the population mean and ơ1.164 be the population...
 Question 7 Not yet anowered Points out of 7.00 g qestion Independent random samples from two regions in the same area gave the following chemical measurements (ppm). Assume the population distributions of the chemical are mound-shaped and symmetric two regions for these Region I: 1-12 981 726 686 496 657 627 815 504 950 605 570 520 Region 11: 2-16 1024 830 526 502 539 373 888 685 868 1093 1132 792 1081 722 1092 844 Let μ1-678 be the...
 Independent random samples of professional foctball and basketball players gave the following information. Heights (In ft) of pro football players: x1i n1 45 6.35 6.52 6.50 6.25 6.50 6.33 6.25 6.17 6.42 6.33 6.42 6.58 6.08 6.58 6.50 6.42 6.25 6.07 5.01 G.OD 6.50 5.83 5.91 5.67 6.0D .0B 6.17 6.58 6.50 6.25 Hcights (in ft) of pro basketball players: x2i n2 40 6.05 6.5S5 6.25 6.5 6.25 5.92 7.00 641 6.75 6.25 .00 6.92 6.83 6.5 .41 6.07 6.07...
Most questions answered within 3 hours.
-
An MNE is this kind of industry when competition in one country
is essentially independent of...
asked 1 hour ago -
. For this set of questions, determine what
proportion of a normal distribution is located betweeneach...
asked 1 hour ago -
A college student is employed as a door-to-door newspaper
salesman. Historical data suggests that the student...
asked 2 hours ago -
MATLAB HW 11 problem using Switch Case and Input commands
Write a script file that calculates...
asked 2 hours ago -
Considering gravitational time dilation, calculate the time that
passes in Earth’s surface while 1 hour passes...
asked 3 hours ago -
Minitab Problem: Take the Lake Hume June rainfall data and find
use the processes outlined in...
asked 3 hours ago -
X Company is trying to decide whether to continue using old
equipment to make Product A...
asked 3 hours ago -
IN PYTHON ONLY !! Program 2: Re-work
program #5 (WeeklyHours) from the previous assignment such that...
asked 4 hours ago -
The average length of time between arrivals at a turnpike
toll-booth is 26 seconds. What is...
asked 6 hours ago -
(a) A piston at 6.1 atm contains a gas that occupies a volume of
3.5 L....
asked 7 hours ago -
Please answer true or false. Words
cannot be changed or added in to make it true...
asked 7 hours ago -
An empty test tube weighs 15.923 grams. Then,
MgCl2•6H2O is added into the test tube. After...
asked 7 hours ago