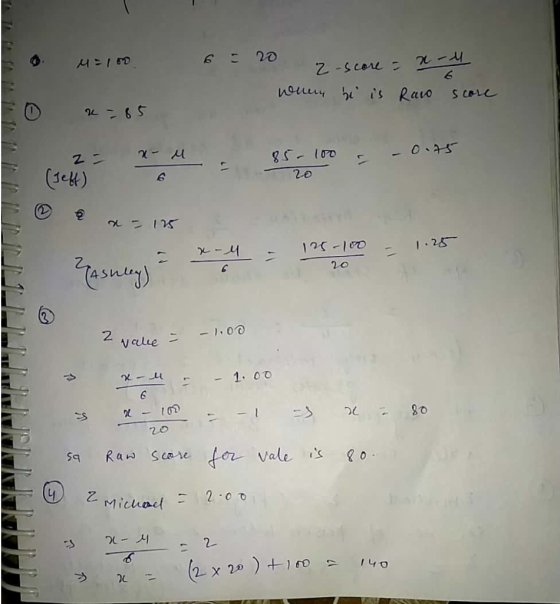
Suppose you are working with a data set in which the mean = 100, and the standard deviation = 20.

- What is the z-score for Jeff, who has a raw score of 85?
- What is the z-score for Ashley, who has a raw score of 125?
- What is the raw score for Vale, who has a z-score of -1.00?
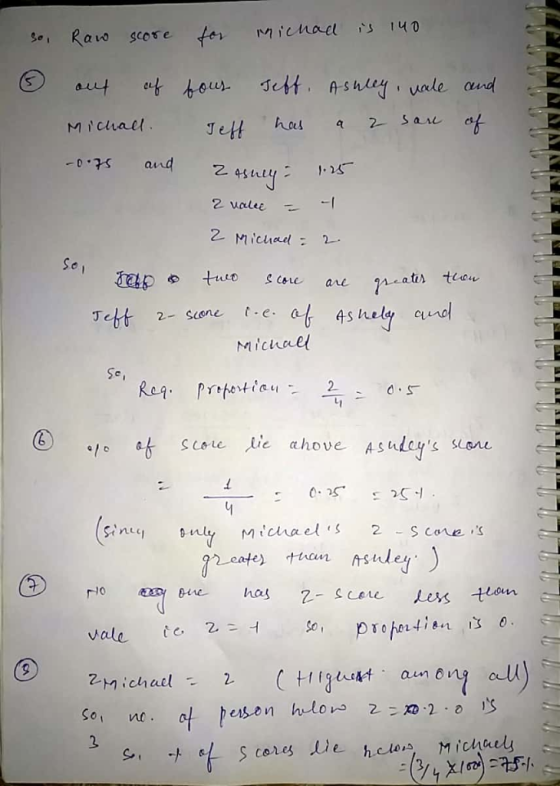
- What is the raw score for Michael, who has a z-score of 2.00?
- What proportion of scores lie above Jeff’s score?
- What percentage of scores lie above Ashley’s score?
- What proportion of scores lie below Vale’s scores?
- What percentage of scores lie below Michael’s score?
- What proportion of scores lie between the mean and Jeff’s score?
- What proportion of scores lie between the mean and Vale’s score?
- What proportion of scores lie between Vale and Michael’s scores?
- What proportion of scores lie between Ashley and Vale’s scores?
- What z score represents the 75th percentile?
- What z score represents the 25th percentile?
- What raw score represents the 75th percentile?
- What raw score represents the 25th percentile?
17.What raw score represents the 50th percentile?
Homework Answers
Add Answer to:
Suppose you are working with a data set in which the mean = 100,
and the...
Suppose the scores on a statistic exam are normally distributed with a mean of 77 and...
Suppose the scores on a statistic exam are normally distributed with a mean of 77 and a variance of 25. What is the 25th percentile of the scores? What is the percentile of someone who got a score of 62? What proportion of the scores are between 80 and 90? Suppose you select 35 tests at random, what is the proportion of scores above 85?
In a normal distribution of = 50 and SD = 7: What is the score at...
In a normal distribution of = 50 and SD = 7: What is the score at the 75th percentile (hint: on the table, find the z-score at .750 and change back to a raw score)? Find the percent of cases scoring above 55. Between what scores to the middle 25% of the cases lie? Beyond what scores do the most extreme cases lie?
(Multiple part question) The following normal curve represents scores from a population on a test of...
(Multiple part question) The following normal curve represents scores from a population on a test of musical ability. The population mean of the test is µ=60. The population standard deviation of the test is σ=14. a. What proportion (not percentage) of people have scores above 69 (rounded to four decimals) given that a z score for 69 = 0.64? b. What proportion (not percentage) of people have scores below 43 (rounded to four decimals) given that a z score for...
A 100-item test has a mean of 75 and standard deviation of 10. Assuming the scores...
 A 100-item test has a mean of 75 and standard deviation of 10. Assuming the scores are normally distributed determine the raw score (rounded to the nearest integer) corresponding to the 25th percentile. (Fill in the corresponding blanks)
Normal Probability Distribution Instructions: Read the scenario and answer the questions below. R...
 Normal Probability Distribution Instructions: Read the scenario and answer the questions below. Round al probablities and proportions to 4 dedimal places The Graduate Record Examination (GRE) is a test required for admission to many U.S. graduate schools. Students' scores on the quantitative portion of the GRE follow a normal distribution with mean 150 and standard deviation 8.8. (Source:www.ets.org). A grad school requires that students score above 160 to be admitted. 1. What proportion of combined GRE scores can be expected...
You will be given a series of questions regarding a normal distribution, you will be asked...
 You will be given a series of questions regarding a normal
distribution, you will be asked to either determine the percentage
above or below particular raw scores; or to calculate the raw score
that will correspond to a particular percentage.
You will be asked to calculate either raw scores or
percentages. For each question write out your calculation, the
appropriate Z score, what on the curve you should be shading, the
exact percentage from the normal curve table and the...
You will be given a series of questions regarding a normal
distribution, you will be asked to either determine the percentage
above or below particular raw scores; or to calculate the raw score
that will correspond to a particular percentage.
You will be asked to calculate either raw scores or
percentages. For each question write out your calculation, the
appropriate Z score, what on the curve you should be shading, the
exact percentage from the normal curve table and the...
Calculating percentages You will be glven a series of questions regarding a normal distribution, you will...
 Calculating percentages
You will be glven a series of questions regarding a normal distribution, you will be asked to elther determine the percentage above or below particular raw scores; or to calculate the raw score that will correspond to a particular percentage. You will be asked to calculate either raw scores or percentages. For each questign write out your calculation, the appropriate Z score, what on the curve you should be shading, the exact percentage from the normal curve table...
Calculating percentages
You will be glven a series of questions regarding a normal distribution, you will be asked to elther determine the percentage above or below particular raw scores; or to calculate the raw score that will correspond to a particular percentage. You will be asked to calculate either raw scores or percentages. For each questign write out your calculation, the appropriate Z score, what on the curve you should be shading, the exact percentage from the normal curve table...
Instructions: Read the scenario and answer the questions below. Round all probabilities and proportions to 4...
 Instructions: Read the scenario and answer the questions below. Round all probabilities and proportions to 4 decimal places. The Graduate Record Examination (GRE) is a test required for admission to many U.S. graduate schools. Students' scores on the quantitative portion of the GRE follow a normal distribution with mean 150 and standard deviation 8.8. (Source:www.ets.org). A graduate school requires that students score above 160 to be admitted. 1. What proportion of combined GRE scores can be expected to be over...
Question 4 0.5 pts A data set has a mean of 44. In this data set,...
 Question 4 0.5 pts A data set has a mean of 44. In this data set, a raw score X-40 corresponds to the standardized score z-1. What is the standard deviation for this data set? Hint:take advantage of the formula for Z-score Question 5 0.5 pts A data set has a standard deviation of 2.5. In this data set, a raw score X-30 corresponds to the standardized score z = 1.30. What is the mean of this data set? Hint:take...
-Suppose the birth weights of full-term babies are normally distributed with mean 3700 grams and standard...
-Suppose the birth weights of full-term babies are normally distributed with mean 3700 grams and standard deviation of 490 grams. a. Draw a normal curve with the parameters labeled and shade the region that represents the proportion of full-term babies who weigh more than 4680 grams. b. Find the proportion of full-term babies who weigh more than 4680 grams. -Find each of the following. Include a diagram for each: a. Find the z-score such that the area under the standard...
 A 100-item test has a mean of 75 and standard deviation of 10. Assuming the scores are normally distributed determine the raw score (rounded to the nearest integer) corresponding to the 25th percentile. (Fill in the corresponding blanks)
 Normal Probability Distribution Instructions: Read the scenario and answer the questions below. Round al probablities and proportions to 4 dedimal places The Graduate Record Examination (GRE) is a test required for admission to many U.S. graduate schools. Students' scores on the quantitative portion of the GRE follow a normal distribution with mean 150 and standard deviation 8.8. (Source:www.ets.org). A grad school requires that students score above 160 to be admitted. 1. What proportion of combined GRE scores can be expected...
 You will be given a series of questions regarding a normal
distribution, you will be asked to either determine the percentage
above or below particular raw scores; or to calculate the raw score
that will correspond to a particular percentage.
You will be asked to calculate either raw scores or
percentages. For each question write out your calculation, the
appropriate Z score, what on the curve you should be shading, the
exact percentage from the normal curve table and the...
You will be given a series of questions regarding a normal
distribution, you will be asked to either determine the percentage
above or below particular raw scores; or to calculate the raw score
that will correspond to a particular percentage.
You will be asked to calculate either raw scores or
percentages. For each question write out your calculation, the
appropriate Z score, what on the curve you should be shading, the
exact percentage from the normal curve table and the...
 Calculating percentages
You will be glven a series of questions regarding a normal distribution, you will be asked to elther determine the percentage above or below particular raw scores; or to calculate the raw score that will correspond to a particular percentage. You will be asked to calculate either raw scores or percentages. For each questign write out your calculation, the appropriate Z score, what on the curve you should be shading, the exact percentage from the normal curve table...
Calculating percentages
You will be glven a series of questions regarding a normal distribution, you will be asked to elther determine the percentage above or below particular raw scores; or to calculate the raw score that will correspond to a particular percentage. You will be asked to calculate either raw scores or percentages. For each questign write out your calculation, the appropriate Z score, what on the curve you should be shading, the exact percentage from the normal curve table...
 Instructions: Read the scenario and answer the questions below. Round all probabilities and proportions to 4 decimal places. The Graduate Record Examination (GRE) is a test required for admission to many U.S. graduate schools. Students' scores on the quantitative portion of the GRE follow a normal distribution with mean 150 and standard deviation 8.8. (Source:www.ets.org). A graduate school requires that students score above 160 to be admitted. 1. What proportion of combined GRE scores can be expected to be over...
 Question 4 0.5 pts A data set has a mean of 44. In this data set, a raw score X-40 corresponds to the standardized score z-1. What is the standard deviation for this data set? Hint:take advantage of the formula for Z-score Question 5 0.5 pts A data set has a standard deviation of 2.5. In this data set, a raw score X-30 corresponds to the standardized score z = 1.30. What is the mean of this data set? Hint:take...
Most questions answered within 3 hours.
-
Combustion of an unknown compound containing only carbon and
hydrogen produces 54.9 g of CO₂ and...
asked 9 minutes ago -
A basketball player achieves a hang time, the total time of
flight, of 0.748 s when...
asked 9 minutes ago -
A processor of carrots cuts the green top off each carrot,
washes the carrots, and inserts...
asked 21 minutes ago -
Please help me find the coefficient of kinetic and static
friction of two masses (500kg and...
asked 18 minutes ago -
Stanley Department Stores reported net income of $815,000 for
the year ended December 31, 2018.
Additional...
asked 23 minutes ago -
Below are the node_struct, link, list_struct and
list as defined in class and in hw3: typedef...
asked 21 minutes ago -
BA Corp is issuing a 10-year bond with a coupon rate of 6.00
percent. The interest...
asked 29 minutes ago -
How does a cell control the cell cycle? Explain 4 different ways
that cell cycle is...
asked 34 minutes ago -
We have to write some code to simulate
rabbits population growth in Australia. We have determined...
asked 35 minutes ago -
Presidential Aviation has provided charter flights to a wide
array of customers, including business travelers worldwide....
asked 48 minutes ago -
Discuss the significance of accounting systems in generating
reliable accounting information (200 words)
asked 54 minutes ago -
McCracken Aerial,
Inc., produces and sells a unique type of TV antenna. The company
has just...
asked 1 hour ago