
Homework Answers

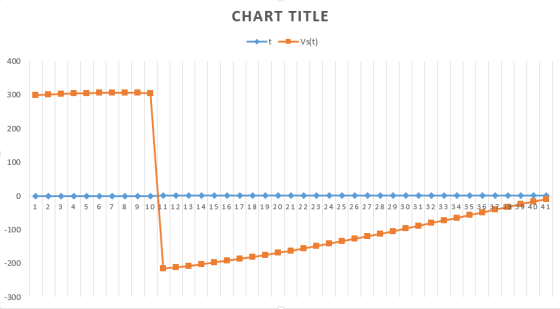
Vs(t) Vs t (Using EXCEL)
| t | A | B | C | D | Vs(t) |
| 0 | 100 | 0 | 200 | 0 | 300 |
| 0.01 | 99.98 | 1.249479 | 199.84 | 0.999733 | 302.0692 |
| 0.02 | 99.92001 | 2.495835 | 199.3603 | 1.997867 | 303.7741 |
| 0.03 | 99.82005 | 3.735953 | 198.5617 | 2.992805 | 305.1105 |
| 0.04 | 99.68017 | 4.966733 | 197.4455 | 3.982955 | 306.0753 |
| 0.05 | 99.50042 | 6.185099 | 196.0133 | 4.966733 | 306.6656 |
| 0.06 | 99.28086 | 7.388005 | 194.2676 | 5.942566 | 306.879 |
| 0.07 | 99.0216 | 8.572445 | 192.2111 | 6.908891 | 306.714 |
| 0.08 | 98.72273 | 9.735459 | 189.8471 | 7.864164 | 306.1694 |
| 0.09 | 98.38437 | 10.87414 | 187.1794 | 8.806856 | 305.2447 |
| 1 | -41.6147 | -23.9731 | -130.729 | -18.9201 | -215.237 |
| 1.01 | -43.4248 | -23.5887 | -124.571 | -19.5584 | -211.143 |
| 1.02 | -45.2176 | -23.1454 | -118.215 | -20.1654 | -206.743 |
| 1.03 | -46.9923 | -22.6442 | -111.669 | -20.7402 | -202.046 |
| 1.04 | -48.7482 | -22.0864 | -104.944 | -21.2818 | -197.061 |
| 1.05 | -50.4846 | -21.4734 | -98.0522 | -21.7894 | -191.8 |
| 1.06 | -52.2008 | -20.8067 | -91.003 | -22.2621 | -186.273 |
| 1.07 | -53.8961 | -20.088 | -83.8082 | -22.6992 | -180.492 |
| 1.08 | -55.5699 | -19.3191 | -76.4794 | -23.1 | -174.468 |
| 1.09 | -57.2215 | -18.5019 | -69.0282 | -23.4638 | -168.215 |
| 1.1 | -58.8501 | -17.6385 | -61.4666 | -23.7901 | -161.745 |
| 1.11 | -60.4552 | -16.731 | -53.8066 | -24.0783 | -155.071 |
| 1.12 | -62.0362 | -15.7817 | -46.0606 | -24.328 | -148.206 |
| 1.13 | -63.5923 | -14.7929 | -38.2409 | -24.5388 | -141.165 |
| 1.14 | -65.123 | -13.7671 | -30.36 | -24.7103 | -133.96 |
| 1.15 | -66.6276 | -12.707 | -22.4305 | -24.8423 | -126.607 |
| 1.16 | -68.1056 | -11.6151 | -14.4652 | -24.9345 | -119.12 |
| 1.17 | -69.5563 | -10.4941 | -6.47666 | -24.9869 | -111.514 |
| 1.18 | -70.9793 | -9.34692 | 1.522189 | -24.9993 | -103.803 |
| 1.19 | -72.3738 | -8.17637 | 9.518607 | -24.9717 | -96.0032 |
| 1.2 | -73.7394 | -6.98539 | 17.4998 | -24.9041 | -88.1291 |
| 1.21 | -75.0755 | -5.77694 | 25.45299 | -24.7967 | -80.1961 |
| 1.22 | -76.3815 | -4.55406 | 33.36547 | -24.6497 | -72.2198 |
| 1.23 | -77.657 | -3.3198 | 41.22456 | -24.4632 | -64.2154 |
| 1.24 | -78.9015 | -2.07724 | 49.01771 | -24.2375 | -56.1985 |
| 1.25 | -80.1144 | -0.82948 | 56.73244 | -23.9731 | -48.1845 |
| 1.26 | -81.2952 | 0.420348 | 64.35641 | -23.6703 | -40.1888 |
| 1.27 | -82.4435 | 1.669125 | 71.87742 | -23.3297 | -32.2267 |
| 1.28 | -83.5589 | 2.91373 | 79.28344 | -22.9518 | -24.3135 |
| 1.29 | -84.6408 | 4.151053 | 86.56263 | -22.5371 | -16.4642 |
| 1.3 | -85.6889 | 5.378 | 93.70333 | -22.0864 | -8.69391 |
q(t) Vs t
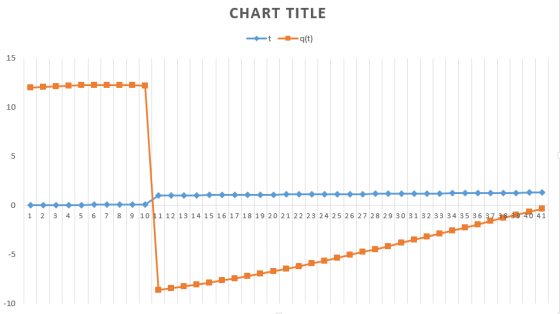
| t | A | B | C | D | q(t) |
| 0 | 4 | 0 | 8 | 0 | 12 |
| 0.01 | 3.9992 | 0.049979 | 7.993601 | 0.039989 | 12.08277 |
| 0.02 | 3.9968 | 0.099833 | 7.974414 | 0.079915 | 12.15096 |
| 0.03 | 3.992802 | 0.149438 | 7.942469 | 0.119712 | 12.20442 |
| 0.04 | 3.987207 | 0.198669 | 7.897818 | 0.159318 | 12.24301 |
| 0.05 | 3.980017 | 0.247404 | 7.840533 | 0.198669 | 12.26662 |
| 0.06 | 3.971235 | 0.29552 | 7.770704 | 0.237703 | 12.27516 |
| 0.07 | 3.960864 | 0.342898 | 7.688444 | 0.276356 | 12.26856 |
| 0.08 | 3.948909 | 0.389418 | 7.593883 | 0.314567 | 12.24678 |
| 0.09 | 3.935375 | 0.434966 | 7.487175 | 0.352274 | 12.20979 |
| 1 | -1.66459 | -0.95892 | -5.22915 | -0.7568 | -8.60946 |
| 1.01 | -1.73699 | -0.94355 | -4.98285 | -0.78234 | -8.44573 |
| 1.02 | -1.8087 | -0.92581 | -4.72859 | -0.80662 | -8.26972 |
| 1.03 | -1.87969 | -0.90577 | -4.46676 | -0.82961 | -8.08182 |
| 1.04 | -1.94993 | -0.88345 | -4.19778 | -0.85127 | -7.88244 |
| 1.05 | -2.01938 | -0.85893 | -3.92209 | -0.87158 | -7.67198 |
| 1.06 | -2.08803 | -0.83227 | -3.64012 | -0.89048 | -7.4509 |
| 1.07 | -2.15585 | -0.80352 | -3.35233 | -0.90797 | -7.21966 |
| 1.08 | -2.2228 | -0.77276 | -3.05918 | -0.924 | -6.97873 |
| 1.09 | -2.28886 | -0.74008 | -2.76113 | -0.93855 | -6.72861 |
| 1.1 | -2.354 | -0.70554 | -2.45866 | -0.9516 | -6.46981 |
| 1.11 | -2.41821 | -0.66924 | -2.15226 | -0.96313 | -6.20284 |
| 1.12 | -2.48145 | -0.63127 | -1.84242 | -0.97312 | -5.92826 |
| 1.13 | -2.54369 | -0.59172 | -1.52963 | -0.98155 | -5.64659 |
| 1.14 | -2.60492 | -0.55069 | -1.2144 | -0.98841 | -5.35841 |
| 1.15 | -2.6651 | -0.50828 | -0.89722 | -0.99369 | -5.06429 |
| 1.16 | -2.72422 | -0.4646 | -0.57861 | -0.99738 | -4.76481 |
| 1.17 | -2.78225 | -0.41976 | -0.25907 | -0.99948 | -4.46056 |
| 1.18 | -2.83917 | -0.37388 | 0.060888 | -0.99997 | -4.15213 |
| 1.19 | -2.89495 | -0.32705 | 0.380744 | -0.99887 | -3.84013 |
| 1.2 | -2.94957 | -0.27942 | 0.699992 | -0.99616 | -3.52516 |
| 1.21 | -3.00302 | -0.23108 | 1.01812 | -0.99187 | -3.20785 |
| 1.22 | -3.05526 | -0.18216 | 1.334619 | -0.98599 | -2.88879 |
| 1.23 | -3.10628 | -0.13279 | 1.648982 | -0.97853 | -2.56862 |
| 1.24 | -3.15606 | -0.08309 | 1.960708 | -0.9695 | -2.24794 |
| 1.25 | -3.20457 | -0.03318 | 2.269297 | -0.95892 | -1.92738 |
| 1.26 | -3.25181 | 0.016814 | 2.574256 | -0.94681 | -1.60755 |
| 1.27 | -3.29774 | 0.066765 | 2.875097 | -0.93319 | -1.28907 |
| 1.28 | -3.34236 | 0.116549 | 3.171338 | -0.91807 | -0.97254 |
| 1.29 | -3.38563 | 0.166042 | 3.462505 | -0.90148 | -0.65857 |
| 1.3 | -3.42756 | 0.21512 | 3.748133 | -0.88345 | -0.34776 |
Problem 7 R1 GV(t) Oa Vst) 9cos (500t)V R 5000 R2 3000 C 10uF R2 Vs(t) V(t) G 2 C ob Consider the circuit above to be i...
 Problem 7 R1 GV(t) Oa Vst) 9cos (500t)V R 5000 R2 3000 C 10uF R2 Vs(t) V(t) G 2 C ob Consider the circuit above to be in steady state and find the Thevenin equivalent between terminals a and b
Problem 7 R1 GV(t) Oa Vst) 9cos (500t)V R 5000 R2 3000 C 10uF R2 Vs(t) V(t) G 2 C ob Consider the circuit above to be in steady state and find the Thevenin equivalent between terminals a and b
Problem 7 R1 GV(t) Oa Vst) 9cos (500t)V R 5000 R2 3000 C 10uF R2 Vs(t) V(t) G 2 C ob Consider the circuit above to be in steady state and find the Thevenin equivalent between terminals a and b
2) a) A plot of DG° vs. Temperature yields a slope of –80 J/K. Is the...
2) a) A plot of DG° vs. Temperature yields a slope of –80 J/K. Is the DS° of the reaction positive or negative? Why? And under what conditions? b) For the reaction: Cl2(g) --> 2Cl(g), predict the sign of DH and DS.
the circuit shown, 1. Find the transfer function H(jw) 2. If R R2 12 and L1mH, plot the frequency response (both the ga...
 the circuit shown, 1. Find the transfer function H(jw) 2. If R R2 12 and L1mH, plot the frequency response (both the gain and the phase shift) of the circuit; 3. Identify the type of filter the circuit is, and state the break (cut off) frequency. R1 v(t)Vcos(ut) L1 R2 Figure 1
the circuit shown, 1. Find the transfer function H(jw) 2. If R R2 12 and L1mH, plot the frequency response (both the gain and the phase shift) of...
the circuit shown, 1. Find the transfer function H(jw) 2. If R R2 12 and L1mH, plot the frequency response (both the gain and the phase shift) of the circuit; 3. Identify the type of filter the circuit is, and state the break (cut off) frequency. R1 v(t)Vcos(ut) L1 R2 Figure 1
the circuit shown, 1. Find the transfer function H(jw) 2. If R R2 12 and L1mH, plot the frequency response (both the gain and the phase shift) of...
Given the following differential equation (a) Find the forced response y(t) to a unit ramp input of u(t). (9%) (Medium) (b) Find the steady-state response y(t) subject to ut) 3cos(0.5t -0.5). (Hi...
 Given the following differential equation (a) Find the forced response y(t) to a unit ramp input of u(t). (9%) (Medium) (b) Find the steady-state response y(t) subject to ut) 3cos(0.5t -0.5). (Hint: use the frequency response formula.) (996) (Easy)
Given the following differential equation (a) Find the forced response y(t) to a unit ramp input of u(t). (9%) (Medium) (b) Find the steady-state response y(t) subject to ut) 3cos(0.5t -0.5). (Hint: use the frequency response formula.) (996) (Easy)
Given the following differential equation (a) Find the forced response y(t) to a unit ramp input of u(t). (9%) (Medium) (b) Find the steady-state response y(t) subject to ut) 3cos(0.5t -0.5). (Hint: use the frequency response formula.) (996) (Easy)
solve the circuit following the steps For the sample AC circuit 2: vst) 31H Zeq Vs(t)...
 solve the circuit following the steps
For the sample AC circuit 2: vst) 31H Zeq Vs(t) = 10 cos (10t + 90°) V (Variations: Changes in resistor and source values and directions).) B. Determine Step 1: The voltage phasor VSF Step 2: The equivalent impedance Zeq Step 3: The phasor current IF Step 4: The steady state current l(t)ss Step 5: The complex power (S = VsFlF* = P + jQ). Step 6: The average (P) and reactive power (Q)....
solve the circuit following the steps
For the sample AC circuit 2: vst) 31H Zeq Vs(t) = 10 cos (10t + 90°) V (Variations: Changes in resistor and source values and directions).) B. Determine Step 1: The voltage phasor VSF Step 2: The equivalent impedance Zeq Step 3: The phasor current IF Step 4: The steady state current l(t)ss Step 5: The complex power (S = VsFlF* = P + jQ). Step 6: The average (P) and reactive power (Q)....
What is the slope of log Im vs log R plot? 4. What is the slope of log Im vs log R plot? 4.
 What is the slope of log Im vs log R plot? 4.
What is the slope of log Im vs log R plot? 4.
What is the slope of log Im vs log R plot? 4.
4. Compute and plot the results of each of the following convolutions: (a) ut) u(t- 2)...
 4. Compute and plot the results of each of the following convolutions: (a) ut) u(t- 2) (b) a(t-1)、n(t-2) (d) u2) ut) t- 2)] (e) u2) [ul) - u(t - 2)]
Problem 1: Let y()- r(t+2)-r(t+1)+r(t)-r(t-1)-u(t-1)-r(t-2)+r(t-3), where r(t) is the ramp function. a) plot y(t) b) plot...
 Problem 1: Let y()- r(t+2)-r(t+1)+r(t)-r(t-1)-u(t-1)-r(t-2)+r(t-3), where r(t) is the ramp function. a) plot y(t) b) plot y'() c) Plot y(2t-3) d) calculate the energy of y(t) note: r(t) = t for t 0 and 0 for t < 0 Problem 2: Let x(t)s u(t)-u(t-2) and y(t) = t[u(t)-u(t-1)] a) b) plot x(t) and y(t) evaluate graphically and plot z(t) = x(t) * y(t) Problem 3: An LTI system has the impulse response h(t) = 5e-tu(t)-16e-2tu(t) + 13e-3t u(t) The input...
7. Find the zero-state response of the input signal r(t) = ej2t for the LTIC system...
 7. Find the zero-state response of the input signal r(t) = ej2t for the LTIC system with the unit impulse response h(t) = e-tu(t).
A plot of ΔG (in units of kJ/mol) vs. T (K) yields a straight line with...
A plot of ΔG (in units of kJ/mol) vs. T (K) yields a straight line with the equation: y = -10.935x + 114.5. What is the value of ΔH (kJ/mol) for the reaction, based on this data? Express your response to two digits after the decimal.
 Problem 7 R1 GV(t) Oa Vst) 9cos (500t)V R 5000 R2 3000 C 10uF R2 Vs(t) V(t) G 2 C ob Consider the circuit above to be in steady state and find the Thevenin equivalent between terminals a and b
Problem 7 R1 GV(t) Oa Vst) 9cos (500t)V R 5000 R2 3000 C 10uF R2 Vs(t) V(t) G 2 C ob Consider the circuit above to be in steady state and find the Thevenin equivalent between terminals a and b
Problem 7 R1 GV(t) Oa Vst) 9cos (500t)V R 5000 R2 3000 C 10uF R2 Vs(t) V(t) G 2 C ob Consider the circuit above to be in steady state and find the Thevenin equivalent between terminals a and b
 the circuit shown, 1. Find the transfer function H(jw) 2. If R R2 12 and L1mH, plot the frequency response (both the gain and the phase shift) of the circuit; 3. Identify the type of filter the circuit is, and state the break (cut off) frequency. R1 v(t)Vcos(ut) L1 R2 Figure 1
the circuit shown, 1. Find the transfer function H(jw) 2. If R R2 12 and L1mH, plot the frequency response (both the gain and the phase shift) of...
the circuit shown, 1. Find the transfer function H(jw) 2. If R R2 12 and L1mH, plot the frequency response (both the gain and the phase shift) of the circuit; 3. Identify the type of filter the circuit is, and state the break (cut off) frequency. R1 v(t)Vcos(ut) L1 R2 Figure 1
the circuit shown, 1. Find the transfer function H(jw) 2. If R R2 12 and L1mH, plot the frequency response (both the gain and the phase shift) of...
 Given the following differential equation (a) Find the forced response y(t) to a unit ramp input of u(t). (9%) (Medium) (b) Find the steady-state response y(t) subject to ut) 3cos(0.5t -0.5). (Hint: use the frequency response formula.) (996) (Easy)
Given the following differential equation (a) Find the forced response y(t) to a unit ramp input of u(t). (9%) (Medium) (b) Find the steady-state response y(t) subject to ut) 3cos(0.5t -0.5). (Hint: use the frequency response formula.) (996) (Easy)
Given the following differential equation (a) Find the forced response y(t) to a unit ramp input of u(t). (9%) (Medium) (b) Find the steady-state response y(t) subject to ut) 3cos(0.5t -0.5). (Hint: use the frequency response formula.) (996) (Easy)
 solve the circuit following the steps
For the sample AC circuit 2: vst) 31H Zeq Vs(t) = 10 cos (10t + 90°) V (Variations: Changes in resistor and source values and directions).) B. Determine Step 1: The voltage phasor VSF Step 2: The equivalent impedance Zeq Step 3: The phasor current IF Step 4: The steady state current l(t)ss Step 5: The complex power (S = VsFlF* = P + jQ). Step 6: The average (P) and reactive power (Q)....
solve the circuit following the steps
For the sample AC circuit 2: vst) 31H Zeq Vs(t) = 10 cos (10t + 90°) V (Variations: Changes in resistor and source values and directions).) B. Determine Step 1: The voltage phasor VSF Step 2: The equivalent impedance Zeq Step 3: The phasor current IF Step 4: The steady state current l(t)ss Step 5: The complex power (S = VsFlF* = P + jQ). Step 6: The average (P) and reactive power (Q)....
 What is the slope of log Im vs log R plot? 4.
What is the slope of log Im vs log R plot? 4.
What is the slope of log Im vs log R plot? 4.
 4. Compute and plot the results of each of the following convolutions: (a) ut) u(t- 2) (b) a(t-1)、n(t-2) (d) u2) ut) t- 2)] (e) u2) [ul) - u(t - 2)]
 Problem 1: Let y()- r(t+2)-r(t+1)+r(t)-r(t-1)-u(t-1)-r(t-2)+r(t-3), where r(t) is the ramp function. a) plot y(t) b) plot y'() c) Plot y(2t-3) d) calculate the energy of y(t) note: r(t) = t for t 0 and 0 for t < 0 Problem 2: Let x(t)s u(t)-u(t-2) and y(t) = t[u(t)-u(t-1)] a) b) plot x(t) and y(t) evaluate graphically and plot z(t) = x(t) * y(t) Problem 3: An LTI system has the impulse response h(t) = 5e-tu(t)-16e-2tu(t) + 13e-3t u(t) The input...
 7. Find the zero-state response of the input signal r(t) = ej2t for the LTIC system with the unit impulse response h(t) = e-tu(t).
Most questions answered within 3 hours.
-
Calculate Ecell for the following reaction and conditions: 0.50
M Br2 (aq), 0.10 M Pb+2 (aq),...
asked 1 minute ago -
There can be more than one correct answer.
Hypophysiotropic hormones:
A. released by the hypothalamus
B....
asked 6 minutes ago -
Scott Ruskin is the CEO of Decatur Materials. The company has
been struggling for the last...
asked 4 minutes ago -
If you were conducting a study involving twins regarding
genetics and/or upbringing, which would you use?...
asked 26 minutes ago -
Part 1- Inventory: You own a toy company and
you are producing wooden rocking horses. Assume...
asked 35 minutes ago -
What is aromaticity?
Identify aromatic molecules, especially those containing O, N,
S and B
asked 38 minutes ago -
A rubber solid circular wheel of uniform density spins about it
axis at rate of 60...
asked 50 minutes ago -
DNA evidence from an early human skeleton in Britain, shows that
early inhabitants of were blue...
asked 41 minutes ago -
Financial data for Joel de Paris, Inc., for last year
follow:
Joel de Paris, Inc.
Balance...
asked 49 minutes ago -
To practice Problem-Solving Strategy 19.1 Work in Ideal-gas
Processes.
A cylinder with initial volume V contains...
asked 58 minutes ago -
Depreciation for Partial Periods Bean Delivery Company purchased
a new delivery truck for $35,400 on April...
asked 1 hour ago -
Q 5.23:
Jonathan has been doing calculations to determine a missing
component. So far he has...
asked 1 hour ago