
Homework Answers
Add Answer to:
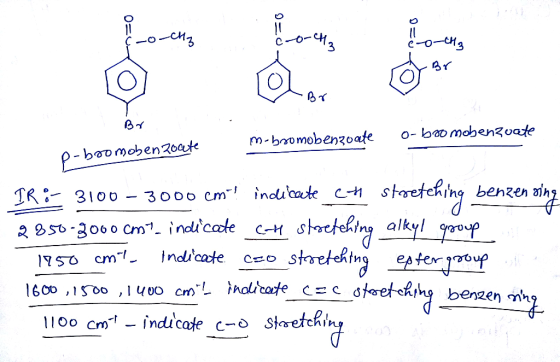
Please draw the structure of bromobenzoate and label the IR
spectra.
--sop arebo617:24:48 2019 CGMT-08 00)...
Please label all important peaks on the IR Spectra. % Transmittance 4000 3500 3000 1500 1000...
 Please label all important peaks on the IR Spectra.
% Transmittance 4000 3500 3000 1500 1000 2500 2000 Wavenumbers (cm-1) Date: Thu Nov 07 13:57:45 2019 (GMT-05:0 Thu Nov 07 13:54:54 2019 (GMT-05:00) Scans: 32
Please label all important peaks on the IR Spectra.
% Transmittance 4000 3500 3000 1500 1000 2500 2000 Wavenumbers (cm-1) Date: Thu Nov 07 13:57:45 2019 (GMT-05:0 Thu Nov 07 13:54:54 2019 (GMT-05:00) Scans: 32
compare the IR spectra of the alcohol and product and comment on the completion of the...
 compare the IR spectra of the alcohol and product and comment
on the completion of the reaction and purity of the product
collected
IR Spectra Alcohol lansmance 4000 3500 3000 1500 2500 2000 Wavenumbers (cm-1) 4000 3500 3000 2921.53 2500 Wavenumbers (cm-1) 2000 IR spectra product 1500 1444 44 1375 29 1000 1143.23 1039.81 916.32 797.83 423.62
compare the IR spectra of the alcohol and product and comment
on the completion of the reaction and purity of the product
collected
IR Spectra Alcohol lansmance 4000 3500 3000 1500 2500 2000 Wavenumbers (cm-1) 4000 3500 3000 2921.53 2500 Wavenumbers (cm-1) 2000 IR spectra product 1500 1444 44 1375 29 1000 1143.23 1039.81 916.32 797.83 423.62
Draw the correct structure for C8H8 by analyzing the spectra below. Label the spectrum and explain...
 Draw the correct structure for C8H8 by analyzing the spectra
below. Label the spectrum and explain your answer.
100 95 90 85 80 75 70 65 60 55 50 45 4000 3500 3000 2500 1500 1000 2000 500 Wavenumbers (cm-1) %Transmittance 2973.42 2940.13 2826.86 1469.79 1386.26 1363.07 1262.57 1020.89 850.92 724.39 459.11 4.5 3.5 3.0 4.0 2.5 2.0 0.5 ppm 1.5 1.0 00 3.04
Draw the correct structure for C8H8 by analyzing the spectra
below. Label the spectrum and explain your answer.
100 95 90 85 80 75 70 65 60 55 50 45 4000 3500 3000 2500 1500 1000 2000 500 Wavenumbers (cm-1) %Transmittance 2973.42 2940.13 2826.86 1469.79 1386.26 1363.07 1262.57 1020.89 850.92 724.39 459.11 4.5 3.5 3.0 4.0 2.5 2.0 0.5 ppm 1.5 1.0 00 3.04
how do I label this IR? this is an IR of (s)-caravone. how would I lable...
 how do I label this IR?
this is an IR of (s)-caravone. how would I lable it
100 huset 34 13:08:29 2019 (GMT-06:00) 3329 48 150 3087.54 %Transmittance 2913.52 1678 35 50 4000 3500 3000 1000 2500 2000 Wavenumbers (cm-1)
how do I label this IR?
this is an IR of (s)-caravone. how would I lable it
100 huset 34 13:08:29 2019 (GMT-06:00) 3329 48 150 3087.54 %Transmittance 2913.52 1678 35 50 4000 3500 3000 1000 2500 2000 Wavenumbers (cm-1)
Identify this compound (label all major functional groups on IR spectra). SAMPLE 100- % TRANSMITTANCE 4000...
 Identify this compound (label all major
functional groups on IR spectra).
SAMPLE 100- % TRANSMITTANCE 4000 1000 3500 3000 2000 1500 2500 WAVENUMBERS 600.1
Identify this compound (label all major
functional groups on IR spectra).
SAMPLE 100- % TRANSMITTANCE 4000 1000 3500 3000 2000 1500 2500 WAVENUMBERS 600.1
Draw the correct structure for C7H6O2 by analyzing the spectra below. Label the spectrum and explain...
 Draw the correct structure for C7H6O2 by analyzing the spectra
below. Label the spectrum and explain your answer.
CORRECTION! Formula is C4H6O4
Sample #2 CyHeOy 94 92 90 88 82 76 70 68 4000 3500 3000 2500 1000 2000 1500 500 Wavenumbers (cm-1) 8 8 2868.76 2530.76 1671.92 1408.84 06 20 1175.52 1270.88 1194.56 997.33 885.17 800.78 636.57 577 42 545.36 504.07 431:38 416.49 401.13 Sampe 4.5 4.0 3.5 3.0 2.5 2.0 Ppm 0.53 00'
Draw the correct structure for C7H6O2 by analyzing the spectra
below. Label the spectrum and explain your answer.
CORRECTION! Formula is C4H6O4
Sample #2 CyHeOy 94 92 90 88 82 76 70 68 4000 3500 3000 2500 1000 2000 1500 500 Wavenumbers (cm-1) 8 8 2868.76 2530.76 1671.92 1408.84 06 20 1175.52 1270.88 1194.56 997.33 885.17 800.78 636.57 577 42 545.36 504.07 431:38 416.49 401.13 Sampe 4.5 4.0 3.5 3.0 2.5 2.0 Ppm 0.53 00'
Label IR spectra %Transmittance 4000 Methyl 3500 Salicylate 3191.67 3000 3154.07 3069.46 3025.59 2953.52 2500 Wavenumbers...
 Label IR spectra
%Transmittance 4000 Methyl 3500 Salicylate 3191.67 3000 3154.07 3069.46 3025.59 2953.52 2500 Wavenumbers (cm-1) 2000 1675.04 1615 50 1577.90 1500 1487.02 1440.02 1327.21 1000 121441
Label IR spectra
%Transmittance 4000 Methyl 3500 Salicylate 3191.67 3000 3154.07 3069.46 3025.59 2953.52 2500 Wavenumbers (cm-1) 2000 1675.04 1615 50 1577.90 1500 1487.02 1440.02 1327.21 1000 121441
Please label all important peaks on the IR Spectra. 92 90 88 86 84 82 80 78 76- 74: 72 70 68 66 64- 62 60 4000 3500 250...
 Please label all important peaks on the IR Spectra.
92 90 88 86 84 82 80 78 76- 74: 72 70 68 66 64- 62 60 4000 3500 2500 2000 3000 1500 1000 Wavenumbers (cm-1) Date: Thu Nov 07 13:57:45 2019 (GMT-05:0Thu Nov 07 13:54:54 2019 (GMT-05:00) Scans: 32 %Transmittance
Please label all important peaks on the IR Spectra.
92 90 88 86 84 82 80 78 76- 74: 72 70 68 66 64- 62 60 4000 3500 2500 2000 3000 1500 1000 Wavenumbers (cm-1) Date: Thu Nov 07 13:57:45 2019 (GMT-05:0Thu Nov 07 13:54:54 2019 (GMT-05:00) Scans: 32 %Transmittance
Can someone label all functional groups for the Ir peaks for these two? Thanks %Transmittance 4000...
 Can
someone label all functional groups for the Ir peaks for these two?
Thanks
%Transmittance 4000 LO 3500 181 Sat Oct 19 08:44.04 2019 (GMT-04:00) 3000 3060.48 3027.71 2990.90 2813.61 2742.06 2500 Wavenumbers (cm-1) 2000 Liquitos 1683.06 1625.411605.01 1575.19 1449.62 1500 1392 54 327.58 1250.78 1203.13 1305 58 1293.93 1178.00123.92 100567 1072 18 1000 972.77 748.10 688.80 605.65 582.83 %Transmittance 4000 3500 3406.27 0.002019 (GMT-04:00) 3000 3020.28 oli 2358.43 2500 Wavenumbers (cm-1) 2000 54 2166-7230 2093.98 1500 1500 150000 Aremate...
Can
someone label all functional groups for the Ir peaks for these two?
Thanks
%Transmittance 4000 LO 3500 181 Sat Oct 19 08:44.04 2019 (GMT-04:00) 3000 3060.48 3027.71 2990.90 2813.61 2742.06 2500 Wavenumbers (cm-1) 2000 Liquitos 1683.06 1625.411605.01 1575.19 1449.62 1500 1392 54 327.58 1250.78 1203.13 1305 58 1293.93 1178.00123.92 100567 1072 18 1000 972.77 748.10 688.80 605.65 582.83 %Transmittance 4000 3500 3406.27 0.002019 (GMT-04:00) 3000 3020.28 oli 2358.43 2500 Wavenumbers (cm-1) 2000 54 2166-7230 2093.98 1500 1500 150000 Aremate...
Task to do: Carefully analyze the two IR spectra at the bottom, and identify one characteristic...
 Task to do: Carefully analyze the two IR spectra at the bottom, and identify one characteristic absorption peak for both the reactant and the product and record it in the following table. Compound Structure Functional group responsible for each peak IR Absorption peaks In cm name IR-1 110 00 90 80 70 - 60 40 30 20 4000 3500 3000 1000 2500 2000 100 Wweumbers (cm-1) IR-2 a00 2018 (GMT 06.00) 110 100 90- 70 60 50- 40 30 3500...
 Please label all important peaks on the IR Spectra.
% Transmittance 4000 3500 3000 1500 1000 2500 2000 Wavenumbers (cm-1) Date: Thu Nov 07 13:57:45 2019 (GMT-05:0 Thu Nov 07 13:54:54 2019 (GMT-05:00) Scans: 32
Please label all important peaks on the IR Spectra.
% Transmittance 4000 3500 3000 1500 1000 2500 2000 Wavenumbers (cm-1) Date: Thu Nov 07 13:57:45 2019 (GMT-05:0 Thu Nov 07 13:54:54 2019 (GMT-05:00) Scans: 32
 compare the IR spectra of the alcohol and product and comment
on the completion of the reaction and purity of the product
collected
IR Spectra Alcohol lansmance 4000 3500 3000 1500 2500 2000 Wavenumbers (cm-1) 4000 3500 3000 2921.53 2500 Wavenumbers (cm-1) 2000 IR spectra product 1500 1444 44 1375 29 1000 1143.23 1039.81 916.32 797.83 423.62
compare the IR spectra of the alcohol and product and comment
on the completion of the reaction and purity of the product
collected
IR Spectra Alcohol lansmance 4000 3500 3000 1500 2500 2000 Wavenumbers (cm-1) 4000 3500 3000 2921.53 2500 Wavenumbers (cm-1) 2000 IR spectra product 1500 1444 44 1375 29 1000 1143.23 1039.81 916.32 797.83 423.62
 Draw the correct structure for C8H8 by analyzing the spectra
below. Label the spectrum and explain your answer.
100 95 90 85 80 75 70 65 60 55 50 45 4000 3500 3000 2500 1500 1000 2000 500 Wavenumbers (cm-1) %Transmittance 2973.42 2940.13 2826.86 1469.79 1386.26 1363.07 1262.57 1020.89 850.92 724.39 459.11 4.5 3.5 3.0 4.0 2.5 2.0 0.5 ppm 1.5 1.0 00 3.04
Draw the correct structure for C8H8 by analyzing the spectra
below. Label the spectrum and explain your answer.
100 95 90 85 80 75 70 65 60 55 50 45 4000 3500 3000 2500 1500 1000 2000 500 Wavenumbers (cm-1) %Transmittance 2973.42 2940.13 2826.86 1469.79 1386.26 1363.07 1262.57 1020.89 850.92 724.39 459.11 4.5 3.5 3.0 4.0 2.5 2.0 0.5 ppm 1.5 1.0 00 3.04
 how do I label this IR?
this is an IR of (s)-caravone. how would I lable it
100 huset 34 13:08:29 2019 (GMT-06:00) 3329 48 150 3087.54 %Transmittance 2913.52 1678 35 50 4000 3500 3000 1000 2500 2000 Wavenumbers (cm-1)
how do I label this IR?
this is an IR of (s)-caravone. how would I lable it
100 huset 34 13:08:29 2019 (GMT-06:00) 3329 48 150 3087.54 %Transmittance 2913.52 1678 35 50 4000 3500 3000 1000 2500 2000 Wavenumbers (cm-1)
 Identify this compound (label all major
functional groups on IR spectra).
SAMPLE 100- % TRANSMITTANCE 4000 1000 3500 3000 2000 1500 2500 WAVENUMBERS 600.1
Identify this compound (label all major
functional groups on IR spectra).
SAMPLE 100- % TRANSMITTANCE 4000 1000 3500 3000 2000 1500 2500 WAVENUMBERS 600.1
 Draw the correct structure for C7H6O2 by analyzing the spectra
below. Label the spectrum and explain your answer.
CORRECTION! Formula is C4H6O4
Sample #2 CyHeOy 94 92 90 88 82 76 70 68 4000 3500 3000 2500 1000 2000 1500 500 Wavenumbers (cm-1) 8 8 2868.76 2530.76 1671.92 1408.84 06 20 1175.52 1270.88 1194.56 997.33 885.17 800.78 636.57 577 42 545.36 504.07 431:38 416.49 401.13 Sampe 4.5 4.0 3.5 3.0 2.5 2.0 Ppm 0.53 00'
Draw the correct structure for C7H6O2 by analyzing the spectra
below. Label the spectrum and explain your answer.
CORRECTION! Formula is C4H6O4
Sample #2 CyHeOy 94 92 90 88 82 76 70 68 4000 3500 3000 2500 1000 2000 1500 500 Wavenumbers (cm-1) 8 8 2868.76 2530.76 1671.92 1408.84 06 20 1175.52 1270.88 1194.56 997.33 885.17 800.78 636.57 577 42 545.36 504.07 431:38 416.49 401.13 Sampe 4.5 4.0 3.5 3.0 2.5 2.0 Ppm 0.53 00'
 Label IR spectra
%Transmittance 4000 Methyl 3500 Salicylate 3191.67 3000 3154.07 3069.46 3025.59 2953.52 2500 Wavenumbers (cm-1) 2000 1675.04 1615 50 1577.90 1500 1487.02 1440.02 1327.21 1000 121441
Label IR spectra
%Transmittance 4000 Methyl 3500 Salicylate 3191.67 3000 3154.07 3069.46 3025.59 2953.52 2500 Wavenumbers (cm-1) 2000 1675.04 1615 50 1577.90 1500 1487.02 1440.02 1327.21 1000 121441
 Please label all important peaks on the IR Spectra.
92 90 88 86 84 82 80 78 76- 74: 72 70 68 66 64- 62 60 4000 3500 2500 2000 3000 1500 1000 Wavenumbers (cm-1) Date: Thu Nov 07 13:57:45 2019 (GMT-05:0Thu Nov 07 13:54:54 2019 (GMT-05:00) Scans: 32 %Transmittance
Please label all important peaks on the IR Spectra.
92 90 88 86 84 82 80 78 76- 74: 72 70 68 66 64- 62 60 4000 3500 2500 2000 3000 1500 1000 Wavenumbers (cm-1) Date: Thu Nov 07 13:57:45 2019 (GMT-05:0Thu Nov 07 13:54:54 2019 (GMT-05:00) Scans: 32 %Transmittance
 Can
someone label all functional groups for the Ir peaks for these two?
Thanks
%Transmittance 4000 LO 3500 181 Sat Oct 19 08:44.04 2019 (GMT-04:00) 3000 3060.48 3027.71 2990.90 2813.61 2742.06 2500 Wavenumbers (cm-1) 2000 Liquitos 1683.06 1625.411605.01 1575.19 1449.62 1500 1392 54 327.58 1250.78 1203.13 1305 58 1293.93 1178.00123.92 100567 1072 18 1000 972.77 748.10 688.80 605.65 582.83 %Transmittance 4000 3500 3406.27 0.002019 (GMT-04:00) 3000 3020.28 oli 2358.43 2500 Wavenumbers (cm-1) 2000 54 2166-7230 2093.98 1500 1500 150000 Aremate...
Can
someone label all functional groups for the Ir peaks for these two?
Thanks
%Transmittance 4000 LO 3500 181 Sat Oct 19 08:44.04 2019 (GMT-04:00) 3000 3060.48 3027.71 2990.90 2813.61 2742.06 2500 Wavenumbers (cm-1) 2000 Liquitos 1683.06 1625.411605.01 1575.19 1449.62 1500 1392 54 327.58 1250.78 1203.13 1305 58 1293.93 1178.00123.92 100567 1072 18 1000 972.77 748.10 688.80 605.65 582.83 %Transmittance 4000 3500 3406.27 0.002019 (GMT-04:00) 3000 3020.28 oli 2358.43 2500 Wavenumbers (cm-1) 2000 54 2166-7230 2093.98 1500 1500 150000 Aremate...
 Task to do: Carefully analyze the two IR spectra at the bottom, and identify one characteristic absorption peak for both the reactant and the product and record it in the following table. Compound Structure Functional group responsible for each peak IR Absorption peaks In cm name IR-1 110 00 90 80 70 - 60 40 30 20 4000 3500 3000 1000 2500 2000 100 Wweumbers (cm-1) IR-2 a00 2018 (GMT 06.00) 110 100 90- 70 60 50- 40 30 3500...
Most questions answered within 3 hours.
-
Consider the following fitness regime for a single locus trait
with two co-dominant alleles: w11 =...
asked 2 minutes ago -
A large cable company reports the following.
80% of its customers subscribe to its cable TV...
asked 18 minutes ago -
Please answer the question in brief.
Discuss the role of ERP in organizations. Are ERP tools...
asked 3 minutes ago -
Discuss the pros and cons of collaborative software such
as SameTime. Does it increase productivity? What...
asked 16 minutes ago -
1. Are all good samples random?
2. Magazines often report surveys giving statistics such as “63%...
asked 11 minutes ago -
Buying your in-laws a gift because it’s expected is
due to the ____________ motive of gift-giving....
asked 19 minutes ago -
Calculate the expected value, the variance, and the standard
deviation of the given random variable X....
asked 1 hour ago -
A hospital performs 100 surgeries per week. The probability that
complications after surgery occur is 10%....
asked 1 hour ago -
1 point) Given the significance level α=0.01 find the following:
(a) left-tailed z value z= (b)...
asked 1 hour ago -
Assuming you are the head of the software development unit at
Cyber.Soft, explain and justify why...
asked 26 minutes ago -
Magnesium and nitrogen react in a combination reaction to
produce magnesium nitride. 3 Mg + N2...
asked 34 minutes ago -
Two electrons are initially at rest separated by a distance of
2nm. At time t=0, they...
asked 32 minutes ago