
Homework Answers
Let's used minitab:
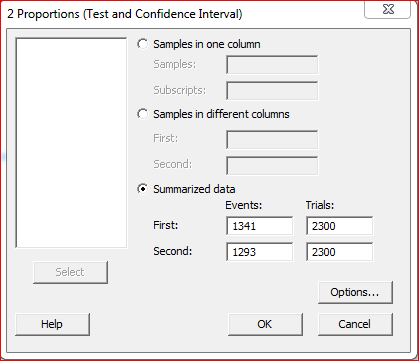
Step 1: Click on Stat >>> Basic Statistics >>>2 Proportions...
Step 2: Select Summarized data
Fill the given information
Look the following picture ...
Then click on Option:
Look the following image:
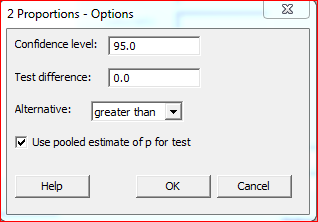
Then click on OK again click on Ok
So we get the following output

From the above output he P - value = 0.081
z = 0.49 , p-value = 0.622
c. Determine the rejection rule:
Decision rule:
1) If p-value < level of significance (alpha) then we reject null hypothesis
2) If p-value > level of significance (alpha) then we fail to reject null hypothesis.
Here p value = 0.622 > 0.05 so we used 2nd rule.
That is we fail to reject null hypothesis
Conclusion: At 5% level of significance there are not sufficient evidence to say that the sample data indicates there are no evidence that the proportions of homeowners and renters differ.
Add Answer to:
A random sample of 2300 adult women indicated that 1341 of them asked for medical assistance...
A random sample of 2000 adult women indicated that 1041 of them asked for medical assistance...
 A random sample of 2000 adult women indicated that 1041 of them asked for medical assistance last time they felt sick. The same sized sample of men indicated that 993 of them asked for medical assistance. Use the z-values rounded to three decimal places to obtain the answers a) Is it reasonable to conclude that women ask for medical assistance more often than men? Use a = 0.05. Find the P-value for this test Round your answer to three decimal...
1 K] Your answer is incorrect. Try again. A random sample of 2300 adult women indicated that 1341...
 1 K] Your answer is incorrect. Try again. A random sample of 2300 adult women indicated that 1341 of them asked for medical assistance last time they felt sick. The same sized sample of men indicated that 1293 of them asked for medical assistance. Use the z-values rounded to three decimal places to obtain the answers. a) Construct a 98% confidence interval for the difference in the two tests. Round your answers to five decimal places (e.g.98.76543). 0.01349 0.05523 b)...
A random sample of 2000 adult women indicated that 1041 of them asked for medical assistance...
 A random sample of 2000 adult women indicated that 1041 of them asked for medical assistance last time they felt sick. The same sized sample of men indicated that 993 of them asked for medical assistance. Use the z-values rounded to three decimal places to obtain the answers. a) Construct a 98% confidence interval for the difference in the two tests. Round your answers to five decimal places (e.g. 98.76543). b) Reconstruct the CI using the alternative procedure described in...
A survey of adult men and women asked, "Which one of the following jobs would you...
 A survey of adult men and women asked, "Which one of the following jobs would you most like to have?" The results of the survey are shown in the Job table (a) Construct a relative frequency distribution for men and women (b) Construct a side-by-side relative frequency bar graph. (c) What are the apparent differences in gender as it pertains to this question? Men Women o 24 13 37 13 Not sure 18 (a) Complete the table below Job omen...
Assume a 2015 Gallup Poll asked a national random sample of 515 adult women to state...
 Assume a 2015 Gallup Poll asked a national random sample of 515 adult women to state their current weight. Assume the mean weight in the sample was = 155. We will treat these data as an SRS from a normally distributed population with standard deviation o = 33 pounds. Give a 99% confidence interval for the mean weight of adult women based on these data. Enter the upper and lower values of your confidence interval into the spaces provided rounded...
A random sample of adult drivers was obtained, 53% men and 46% women. A survey showed...
A random sample of adult drivers was obtained, 53% men and 46% women. A survey showed that 57% of the drivers rely on GPS systems. 32% of the drivers are men and use GPS while 24% of the drivers are women and use GPS. Suppose a person included in this survey is randomly selected. a.) Suppose the person selected is a man. What is the probability that he relies on a GPS system? Your answer should have at least 3...
A random sample of adult drivers was obtained, 55% men and 43% women. A survey showed...
A random sample of adult drivers was obtained, 55% men and 43% women. A survey showed that 57% of the drivers rely on GPS systems. 32% of the drivers are men and use GPS while 21% of the drivers are women and use GPS. Suppose a person included in this survey is randomly selected. a) Suppose the person selected is a man. What is the probability that he relies on a GPS system? Your answer should have at least 3...
A random sample of 15 subjects was asked to perform a given task. The time in...
A random sample of 15 subjects was asked to perform a given task. The time in seconds it took each of them to complete the task is recorded below: 44, 40, 28, 44, 28, 41, 37, 31, 43, 48, 29, 44, 45, 32, 31 Send data to Excel If we assume that the completion times are normally distributed, find a 95% confidence interval for the true mean completion time for this task. Then complete the table below. Carry your intermediate...
in a simple random sample of 190 households, the sample mean number of personal computers was...
in a simple random sample of 190 households, the sample mean number of personal computers was 2.78. assume the population standard deviation is 0.41. a) a 99.8% confidence interval for the mean number of personal computers is ----< mean <----- 2) a simple random sample of eight college freshman were asked about how many hours of sleep they typically got per night. the results were 7.5, 8, 6.5, 24, 8.5, 6.5, 7, 7.5 a) the data contains an outlier that...
A random sample of 1028 adults in a certain large country was asked "Do you pretty...
 A random sample of 1028 adults in a certain large country was asked "Do you pretty much think televisions are a necessity or a luxury you could do without?" Of the 1028 adults surveyed, 527 indicated that televisions are a luxury they could do without. Complete parts (a) through (e) below. Click here to view the standard normal distribution table (page 1). Click here to view the standard normal distribution table (page 2). (a) Obtain a point estimate for the...
 A random sample of 2000 adult women indicated that 1041 of them asked for medical assistance last time they felt sick. The same sized sample of men indicated that 993 of them asked for medical assistance. Use the z-values rounded to three decimal places to obtain the answers a) Is it reasonable to conclude that women ask for medical assistance more often than men? Use a = 0.05. Find the P-value for this test Round your answer to three decimal...
 1 K] Your answer is incorrect. Try again. A random sample of 2300 adult women indicated that 1341 of them asked for medical assistance last time they felt sick. The same sized sample of men indicated that 1293 of them asked for medical assistance. Use the z-values rounded to three decimal places to obtain the answers. a) Construct a 98% confidence interval for the difference in the two tests. Round your answers to five decimal places (e.g.98.76543). 0.01349 0.05523 b)...
 A random sample of 2000 adult women indicated that 1041 of them asked for medical assistance last time they felt sick. The same sized sample of men indicated that 993 of them asked for medical assistance. Use the z-values rounded to three decimal places to obtain the answers. a) Construct a 98% confidence interval for the difference in the two tests. Round your answers to five decimal places (e.g. 98.76543). b) Reconstruct the CI using the alternative procedure described in...
 A survey of adult men and women asked, "Which one of the following jobs would you most like to have?" The results of the survey are shown in the Job table (a) Construct a relative frequency distribution for men and women (b) Construct a side-by-side relative frequency bar graph. (c) What are the apparent differences in gender as it pertains to this question? Men Women o 24 13 37 13 Not sure 18 (a) Complete the table below Job omen...
 Assume a 2015 Gallup Poll asked a national random sample of 515 adult women to state their current weight. Assume the mean weight in the sample was = 155. We will treat these data as an SRS from a normally distributed population with standard deviation o = 33 pounds. Give a 99% confidence interval for the mean weight of adult women based on these data. Enter the upper and lower values of your confidence interval into the spaces provided rounded...
 A random sample of 1028 adults in a certain large country was asked "Do you pretty much think televisions are a necessity or a luxury you could do without?" Of the 1028 adults surveyed, 527 indicated that televisions are a luxury they could do without. Complete parts (a) through (e) below. Click here to view the standard normal distribution table (page 1). Click here to view the standard normal distribution table (page 2). (a) Obtain a point estimate for the...
Most questions answered within 3 hours.
-
An archer shoots an arrow at a bottle. The arrow flys at 34m/s.
There is a...
asked 7 minutes ago -
Multiple choice data structures questions about stacks.
Here is an INCORRECT pseudocode for the algorithm which...
asked 12 minutes ago -
Osmotic forces related to protein concentration differences are
referred to as ________ forces.
asked 16 minutes ago -
Questions:(to
be answered within the video)
Write a C++ program
with the following specifications:
1.
Create...
asked 27 minutes ago -
A 7.55 g sample of an aqueous solution of
hydrochloric acid contains an unknown amount of...
asked 20 minutes ago -
Why would the following user group need accounting information
related to a business? Support your answers...
asked 22 minutes ago -
4. How much work is it to lift a 25 kg sack of cement vertically
4.3...
asked 23 minutes ago -
Write the mechanism for the reaction involving [emim][Br] and
lithium bis(trifluoromethylsulfonyl)imide.
asked 44 minutes ago -
The half life of a specific Tc-99m is 6 hours. How much of an
192 mg...
asked 52 minutes ago -
If you have 35.0g of Na and 100.0g of Cl2, what is the
maximum amount of...
asked 55 minutes ago -
Assume that adults have IQ scores that are normally distributed
with a mean of 96.8 and...
asked 54 minutes ago -
If a product or other segment of a business is generating a
loss, it is erroneous...
asked 58 minutes ago