Problem 4 Use Excel, to create a histogram for the data set. Calculate the cumulate distribution...
Problem 4 Use Excel, to create a histogram for the data set. Calculate the cumulate distribution (CDF), remembering that it cannot exceed a value of "1", and plot it on the histogram. The histogram requires the creation of bins with appropriate labels and the frequency of occurrence in the data set. Properly document the plots.
| 14.81 | 7.92 | 10.50 | 22.59 | 5.62 | 8.01 | 6.53 |
| 10.62 | 5.11 | 6.28 | 9.71 | 3.13 | 3.99 | 7.50 |
| 8.68 | 11.69 | 17.81 | 8.70 | 5.38 | 7.43 | 14.27 |
| 7.52 | 4.09 | 8.71 | 18.17 | 5.10 | 9.66 | 6.44 |
| 13.13 | 25.14 | 6.39 | 6.89 | 9.29 | 10.46 | 8.88 |
| 9.95 | 7.80 | 5.28 | 5.42 | 6.69 | 7.94 | 8.56 |
| 6.11 | 7.59 | 10.84 | 5.60 | 25.61 | 11.59 | 20.48 |
| 12.95 | 11.63 | 18.44 | 14.60 | 15.48 | 8.96 | 11.76 |
| 10.55 | 7.48 | 11.76 | 6.67 | 23.19 | 5.11 | 10.24 |
| 12.51 | 10.03 | 7.33 | 19.18 | 9.15 | 6.40 | 17.09 |
| 9.43 | 7.78 | 11.69 | 13.60 | 12.24 | 8.79 | 9.33 |
| 5.50 | 15.01 | 10.89 | 7.44 | 9.16 | 12.50 | 14.81 |
| 8.78 | 10.78 | 10.36 | 9.63 | 13.28 | 7.85 | 9.07 |
| 8.05 | 17.98 | 8.68 | 5.39 | 10.25 | 16.51 | 4.99 |
| 8.98 | 23.00 | 8.46 | 13.14 | 14.69 | 9.80 | 21.97 |
| 7.46 | 13.90 | 10.29 | 5.65 | 9.61 | 7.02 | 13.76 |
| 10.88 | 7.66 | 6.74 | 6.80 | 13.05 | 9.64 | 20.54 |
| 17.18 | 10.05 | 7.03 | 5.97 | 12.92 | 6.61 | 17.09 |
| 17.74 | 7.72 | 6.65 | 7.13 | 10.68 | 10.77 | 6.72 |
| 13.54 | 8.11 | 17.39 | 8.93 | 24.03 | 10.80 | 7.83 |
Homework Answers
How to draw Cumulative distributive frequency table:-
1) The data should not be in more than 1 column.Set all the data in 1 column.
2) After that,sort the data by using Excel function sort .
3) After that we use the formula that c2(column2) = (1/no of datapoints)+c1
In our example :-
C2 = 0.007142857143
C3 = (1/140)+0.007142857143 = 0.01428571429
similarly for all data points
Then we can plot the graph or any chart like histogram or scatter plot with lines.

Graph with data points:-

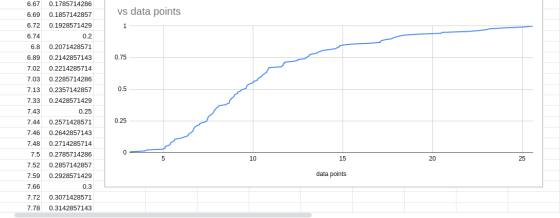
Here i provide google sheets link you can view in that file.
naveenvayilapalli/pdf-distribution in github,here you can download related cdf excel fiel or pdf file
If any doubts you have comment .
I hope you that you will like the answer.
Add Answer to:
Problem 4 Use Excel, to create a histogram for
the data set. Calculate the cumulate distribution...
Most questions answered within 3 hours.
-
exercise on VSEPR and molecular structrue.
octahedral
SeCl62-
TeCl62-
ClF62-
distorted
SeF62–
IF6–
asked 33 minutes ago -
A regression equation that describes the relationship between
the amount of the bill ($) at a...
asked 4 minutes ago -
284 mL of a 0.52 M potassium hydroxide solution is added to 467
mL of a...
asked 32 minutes ago -
Little’s Law: Val d’Costa is a world famous ski village in the
French Alps. Because of...
asked 1 hour ago -
Find the absolute error D for the calculation if A + B/C=D A=
9.4 +/- 0.4...
asked 1 hour ago -
New Air Heating and Cooling, manufactures furnaces and central
air units. The company pride itself on...
asked 1 hour ago -
A coach uses a new technique to train gymnasts. Seven
gymnasts were randomly selected and their...
asked 3 hours ago -
While rotating the tires on your car you notice a rock [mass =
0.1 Kg] stuck...
asked 5 hours ago -
Using MARS simulator, write MIPS programs according to
the following scenarios: Receive a positive integer number...
asked 7 hours ago -
An object in front of a concave mirror has a real image that is
11.5 cm...
asked 7 hours ago -
Consider the reaction, C3 H8 + O2 --> CO2 + H2O. How many
moles of O2...
asked 9 hours ago -
You and your opponent both roll a fair die. If you both roll the
same number,...
asked 9 hours ago