Please need a correct answer and explain it clearly Given the data below, what is the...
Please need a correct answer and explain it clearly
Given the data below, what is the upper control limit for the Range control chart? Please enter your answer with at least 4 significant digits.
Data:
| Observation 1 | Observation 2 | Observation 3 | Observation 4 | Observation 5 |
| 155.1759 | 164.4978 | 144.0894 | 149.1192 | 160.0421 |
| 161.1192 | 145.4001 | 162.7882 | 177.1397 | 162.4125 |
| 161.3671 | 143.0758 | 171.4366 | 158.8492 | 154.7023 |
| 166.1941 | 166.911 | 163.6076 | 151.8873 | 162.9515 |
| 158.7486 | 154.2805 | 180.887 | 178.2488 | 155.1188 |
| 159.233 | 160.6053 | 176.0102 | 175.6228 | 166.1402 |
| 170.6843 | 161.7413 | 169.6049 | 157.7824 | 172.9065 |
| 167.3616 | 148.0186 | 165.7245 | 162.1048 | 163.974 |
| 157.9749 | 148.492 | 167.2943 | 140.076 | 181.7458 |
| 155.6967 | 171.0943 | 152.6593 | 142.4727 | 160.5202 |
| 164.5217 | 157.1935 | 151.1438 | 158.0747 | 155.3919 |
| 167.979 | 141.8374 | 155.4931 | 149.2655 | 163.0297 |
| 163.8557 | 168.984 | 163.8254 | 150.4593 | 160.4368 |
| 171.5194 | 148.2178 | 163.5912 | 157.6182 | 161.8093 |
| 135.6434 | 186.8886 | 152.3281 | 137.6502 | 167.7435 |
| 173.4057 | 159.6673 | 155.0814 | 169.7719 | 179.3919 |
| 169.3266 | 158.3569 | 174.3621 | 173.9279 | 174.052 |
| 154.3969 | 146.7553 | 168.1947 | 148.4083 | 170.2388 |
| 151.6227 | 143.9714 | 164.887 | 142.5745 | 158.1103 |
| 176.3726 | 171.7192 | 158.2436 | 170.3528 | 167.8382 |
| 165.9762 | 150.7074 | 160.5092 | 158.1487 | 179.0462 |
| 177.6822 | 160.1059 | 185.147 | 186.0095 | 174.6436 |
| 166.6542 | 181.4711 | 138.1257 | 171.4638 | 160.0559 |
| 153.1734 | 165.9899 | 168.987 | 165.7046 | 148.5262 |
| 143.6162 | 152.5279 | 177.0654 | 160.5963 | 162.9247 |
| 165.9919 | 176.0156 | 158.9986 | 167.7788 | 169.1682 |
| 178.3369 | 157.5605 | 160.1486 | 177.0536 | 168.5923 |
| 154.2878 | 164.8663 | 158.5857 | 176.5919 | 176.6121 |
| 151.5038 | 170.4999 | 155.6362 | 153.6519 | 174.8804 |
| 173.1002 | 178.7034 | 177.8521 | 162.7629 | 161.4867 |
| 159.0639 | 179.3448 | 170.4143 | 154.9183 | 161.8192 |
| 173.56 | 150.7119 | 171.7711 | 151.7356 | 143.1589 |
| 156.3567 | 171.9441 | 159.2536 | 161.1486 | 158.9801 |
| 154.1641 | 151.0134 | 163.3826 | 169.4772 | 173.8932 |
There are more data but I can't post because it says the question is too large.
So, I need you to explain how to get the answer
Homework Answers
follow the following steps:
- tabulate the observations in a table
- write the subgroup numbers on the left side of the table. if it is given then note down the same subgroups which are given to you.
- for range control chart use the following formulas for calculations
- range (r)= xmax - xmin
ex: for subgroup (n=1), range (r)= 164.4978-144.0894 = 20.4084
likewise, follow the same formula for whole subgroups.
5. r bar= (r1+r2+.........rn) / n
here, there are 34 subgroups. so, n=34
and, r bar= (20.4084+31.7396+28.3608+.........+22.8798) / 34
therefore, r bar = 24.29441
6. upper critical limit (UCLR) and lower critical limits (LCLR) of r chart can be found by using the following formulas
UCLR = D4* r bar and LCLR = D3* r bar
these D4 and D3 should be given along with the question. Or these can be found out by using control chart constants, and this depends on the subgroup number as well.
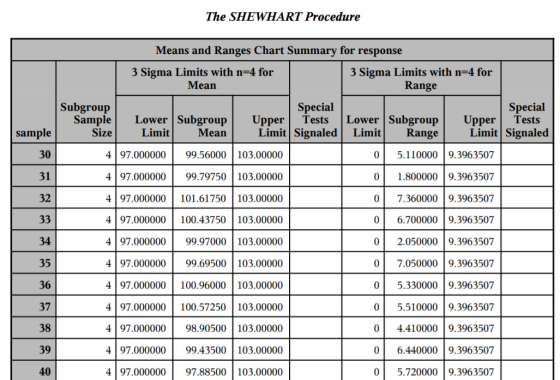
ex: for subgroup 4, sample size 34, D4 = UPPER LIMIT OF RANGE = 9.3963507,
D3 = LOWER LIMIT OF RANGE= 0
So, UCLR =9.3963507 * r bar and LCLR = 0 * r bar
| sample | observation 1 | observation 2 | observation 3 | observation 4 | observation 5 | range (r) | ||
| 1 | 155.1759 | 164.4978 | 144.0894 | 149.1192 | 160.0421 | 20.4084 | ||
| 2 | 161.1192 | 145.4001 | 162.7882 | 177.1397 | 162.4125 | 31.7396 | ||
| 3 | 161.3671 | 143.0758 | 171.4366 | 158.8492 | 154.7023 | 28.3608 | ||
| 4 | 166.1941 | 166.911 | 163.6076 | 151.8873 | 162.9515 | 15.0237 | ||
| 5 | 158.7486 | 154.2805 | 180.887 | 178.2488 | 155.1188 | 26.6065 | ||
| 6 | 159.233 | 160.6053 | 176.0102 | 175.6228 | 166.1402 | 16.7772 | ||
| 7 | 170.6843 | 161.7413 | 169.6049 | 157.7824 | 172.9065 | 15.1241 | ||
| 8 | 167.3616 | 148.0186 | 165.7245 | 162.1048 | 163.974 | 19.343 | ||
| 9 | 157.9749 | 148.492 | 167.2943 | 140.076 | 181.7458 | 41.6698 | ||
| 10 | 155.6967 | 171.0943 | 152.6593 | 142.4727 | 160.5202 | 28.6216 | ||
| 11 | 164.5217 | 157.1935 | 151.1438 | 158.0747 | 155.3919 | 13.3779 | ||
| 12 | 167.979 | 141.8374 | 155.4931 | 149.2655 | 163.0297 | 26.1416 | ||
| 13 | 163.8557 | 168.984 | 163.8254 | 150.4593 | 160.4368 | 18.5247 | ||
| 14 | 171.5194 | 148.2178 | 163.5912 | 157.6182 | 161.8093 | 23.3016 | ||
| 15 | 135.6434 | 186.8886 | 152.3281 | 137.6502 | 167.7435 | 51.2452 | ||
| 16 | 173.4057 | 159.6673 | 155.0814 | 169.7719 | 179.3919 | 24.3105 | ||
| 17 | 169.3266 | 158.3569 | 174.3621 | 173.9279 | 174.052 | 16.0052 | ||
| 18 | 154.3969 | 146.7553 | 168.1947 | 148.4083 | 170.2388 | 23.4835 | ||
| 19 | 151.6227 | 143.9714 | 164.887 | 142.5745 | 158.1103 | 22.3125 | ||
| 20 | 176.3726 | 171.7192 | 158.2436 | 170.3528 | 167.8382 | 18.129 | ||
| 21 | 165.9762 | 150.7074 | 160.5092 | 158.1487 | 179.0462 | 28.3388 | ||
| 22 | 177.6822 | 160.1059 | 185.147 | 186.0095 | 174.6436 | 25.9036 | ||
| 23 | 166.6542 | 181.4711 | 138.1257 | 171.4638 | 160.0559 | 43.3454 | ||
| 24 | 153.1734 | 165.9899 | 168.987 | 165.7046 | 148.5262 | 20.4608 | ||
| 25 | 143.6162 | 152.5279 | 177.0654 | 160.5963 | 162.9247 | 33.4492 | ||
| 26 | 165.9919 | 176.0156 | 158.9986 | 167.7788 | 169.1682 | 17.017 | ||
| 27 | 178.3369 | 157.5605 | 160.1486 | 177.0536 | 168.5923 | 20.7764 | ||
| 28 | 154.2878 | 164.8663 | 158.5857 | 176.5919 | 176.6121 | 22.3243 | ||
| 29 | 151.5038 | 170.4999 | 155.6362 | 153.6519 | 174.8804 | 23.3766 | ||
| 30 | 173.1002 | 178.7034 | 177.8521 | 162.7629 | 161.4867 | 17.2167 | ||
| 31 | 159.0639 | 179.3448 | 170.4143 | 154.9183 | 161.8192 | 24.4265 | ||
| 32 | 173.56 | 150.7119 | 171.7711 | 151.7356 | 143.1589 | 30.4011 | ||
| 33 | 156.3567 | 171.9441 | 159.2536 | 161.1486 | 158.9801 | 15.5874 | ||
| 34 | 154.1641 | 151.0134 | 163.3826 | 169.4772 | 173.8932 | 22.8798 | ||
| r bar= |
24.29441 |
Add Answer to:
Please need a correct answer and explain it clearly
Given the data below, what is the...
Given the data below and using the moving range, what is the upper control limit for...
Given the data below and using the moving range, what is the upper control limit for the Individual X control chart? Please enter your answer with at least 4 significant digits. Observation 1 81.15834 79.02914 94.03565 76.95562 68.12343 84.69328 93.83329 85.0465 87.00802 85.87447 80.43625 80.64723 84.4058 71.69429 81.88967 94.59955 86.44976 94.91153 96.17577 83.77544 88.39259 82.63316 79.46166 72.81443 90.23545 75.0782 97.12718 84.50148 79.19048 87.0875 83.37668 94.72689 93.24145 89.752 87.2753 80.13642
Please solve manually because I do not understand when solving use excel. A quality control analyst...
 Please solve manually because I do not understand when solving
use excel.
A quality control analyst for a lightbulb manufacturer is concerned that the time it takes to produce a batch of lightbulbs is too erratic. Accordingly, the analyst randomly surveys 5 production periods each day for 8 days and records the sample mean and range for each da DAY 2 14.3 3 15.3 5.0 4 12.6 2.8 5 11.8 3.7 TOTAL 113.6 30.8 X-bar 13.6 3.5 12.9 4.8 17.3...
Please solve manually because I do not understand when solving
use excel.
A quality control analyst for a lightbulb manufacturer is concerned that the time it takes to produce a batch of lightbulbs is too erratic. Accordingly, the analyst randomly surveys 5 production periods each day for 8 days and records the sample mean and range for each da DAY 2 14.3 3 15.3 5.0 4 12.6 2.8 5 11.8 3.7 TOTAL 113.6 30.8 X-bar 13.6 3.5 12.9 4.8 17.3...
Correct answer is .0114 mols and 3.95% Need full explanation on how to get there please!...
 Correct answer is .0114 mols and 3.95%
Need full explanation on how to get there please!
III. Adding a complexing agent such as pyrophosphate (OsPOPOs) or triphosphate (P,010) to detergents prevents the magnesium and calcium salts found in "hard" water from precipitating (to form "scum") because the equilibrium constant for complex-ion formation is large, viz: 2+ +4 Were one to add 5.000 mL of 0.0613-MNa4(O;POPOs) to 25.00 mL of 0.0115-M Ca(NO,)2 calculate (i) the mmols of Ca2 ions that remain...
Correct answer is .0114 mols and 3.95%
Need full explanation on how to get there please!
III. Adding a complexing agent such as pyrophosphate (OsPOPOs) or triphosphate (P,010) to detergents prevents the magnesium and calcium salts found in "hard" water from precipitating (to form "scum") because the equilibrium constant for complex-ion formation is large, viz: 2+ +4 Were one to add 5.000 mL of 0.0613-MNa4(O;POPOs) to 25.00 mL of 0.0115-M Ca(NO,)2 calculate (i) the mmols of Ca2 ions that remain...
please answer all the questions and explain and write clearly what do you mean this is...
 please answer all the questions and explain and write
clearly
what do you mean this is all the complete question I have
there is nothing else
You are interested in studying the neurological effects of dehydrogenated brominate oil, a food additive. You randomly select 25 Sprague-Dawley rats and add a dosage to their drinking water. Because the additive is odorless and colorless, the rats readily consume it. After six months you sacrifice the rats, microsection their brains and count the...
please answer all the questions and explain and write
clearly
what do you mean this is all the complete question I have
there is nothing else
You are interested in studying the neurological effects of dehydrogenated brominate oil, a food additive. You randomly select 25 Sprague-Dawley rats and add a dosage to their drinking water. Because the additive is odorless and colorless, the rats readily consume it. After six months you sacrifice the rats, microsection their brains and count the...
10. Match each description to the correct confidence interval in the diagram below. Must get all...
 10. Match each description to the correct confidence interval in the diagram below. Must get all matches correct. No partial credit. Fail to reject H. P> 0.05. Not statistically significant despite large sample size, which justifies acceptance of the null hypothesis (Cl captures 1 because the RR estimate is close to 1). Fall to reject H. P> 0.05. Although the RR estimate is close to 1, we cannot accept the null hypothesis since the Ci is wide (imprecise). Cannot distinguish...
need help with discrete math HW, please write solutions clearly, and please don't give random answer...
 need help with discrete math HW, please write solutions clearly,
and please don't give random answer if you're not sure cus then i
will need to post the same question twice. i appreciate every help
i can get but please let someone else help me solve the question if
you're not sure about any part to avoid reposting. thanks, will
rate best answer.
Let G be the set of 4 x 4 invertible real matrices and let - be matrix...
need help with discrete math HW, please write solutions clearly,
and please don't give random answer if you're not sure cus then i
will need to post the same question twice. i appreciate every help
i can get but please let someone else help me solve the question if
you're not sure about any part to avoid reposting. thanks, will
rate best answer.
Let G be the set of 4 x 4 invertible real matrices and let - be matrix...
please give correct answer 100% please make sure hand writing is clear and easy to read....
 please give correct answer 100% please make sure hand writing is
clear and easy to read. please help me explain clearly the answer
given because i need to understand.
Find the magnitude and arguments of: a) Z1 7 - 12i b) Z2=-1 i
please give correct answer 100% please make sure hand writing is
clear and easy to read. please help me explain clearly the answer
given because i need to understand.
Find the magnitude and arguments of: a) Z1 7 - 12i b) Z2=-1 i
please answer the following question for the given data TN eCampus myOmegaFi I Login Citrix Receiver...
 please answer the following question for the given data
TN eCampus myOmegaFi I Login Citrix Receiver D Quality Book Q Physics II Midterm 6-8 t:1:41:55 Andrew Adcock: Attempt 1 Question 2 (6 points) From the data provided below and a subgroup size of 5, the trial upper control limit for the trial s-chart is most nearly what integer value? Obs Xbarstd dev 513 25 76 30 681506027503401857 686 43 - st 2 1 2 2 2 4 3 2 1...
please answer the following question for the given data
TN eCampus myOmegaFi I Login Citrix Receiver D Quality Book Q Physics II Midterm 6-8 t:1:41:55 Andrew Adcock: Attempt 1 Question 2 (6 points) From the data provided below and a subgroup size of 5, the trial upper control limit for the trial s-chart is most nearly what integer value? Obs Xbarstd dev 513 25 76 30 681506027503401857 686 43 - st 2 1 2 2 2 4 3 2 1...
Please explain clearly why the answer is correct Which of these "curved arrows" describe a mechanism...
 Please explain clearly why the answer is correct
Which of these "curved arrows" describe a mechanism for the formation of a carbocation that has roughly the same stability as this one? HHH - H- C- C 70-I CH H H-C-H Н AA only [B] B only [C] C only [D] B and C only [E] A and C only Explanation for your choice (4 pts)
Please explain clearly why the answer is correct
Which of these "curved arrows" describe a mechanism for the formation of a carbocation that has roughly the same stability as this one? HHH - H- C- C 70-I CH H H-C-H Н AA only [B] B only [C] C only [D] B and C only [E] A and C only Explanation for your choice (4 pts)
please answer and explain why the answer is the correct answer and how you figured it...
 please answer and explain why the answer is the correct answer
and how you figured it out
Free response Practice Guide Review pages 115-177 A 1.0L sample of a pure gas was found to have a lower pressure than that predicted by the ideal gas law. The best explanation for the observation is that molecules of the gas A. Have a combined volume that is too large to be considered negligible when compared to the volume of the container. B....
please answer and explain why the answer is the correct answer
and how you figured it out
Free response Practice Guide Review pages 115-177 A 1.0L sample of a pure gas was found to have a lower pressure than that predicted by the ideal gas law. The best explanation for the observation is that molecules of the gas A. Have a combined volume that is too large to be considered negligible when compared to the volume of the container. B....
 Please solve manually because I do not understand when solving
use excel.
A quality control analyst for a lightbulb manufacturer is concerned that the time it takes to produce a batch of lightbulbs is too erratic. Accordingly, the analyst randomly surveys 5 production periods each day for 8 days and records the sample mean and range for each da DAY 2 14.3 3 15.3 5.0 4 12.6 2.8 5 11.8 3.7 TOTAL 113.6 30.8 X-bar 13.6 3.5 12.9 4.8 17.3...
Please solve manually because I do not understand when solving
use excel.
A quality control analyst for a lightbulb manufacturer is concerned that the time it takes to produce a batch of lightbulbs is too erratic. Accordingly, the analyst randomly surveys 5 production periods each day for 8 days and records the sample mean and range for each da DAY 2 14.3 3 15.3 5.0 4 12.6 2.8 5 11.8 3.7 TOTAL 113.6 30.8 X-bar 13.6 3.5 12.9 4.8 17.3...
 Correct answer is .0114 mols and 3.95%
Need full explanation on how to get there please!
III. Adding a complexing agent such as pyrophosphate (OsPOPOs) or triphosphate (P,010) to detergents prevents the magnesium and calcium salts found in "hard" water from precipitating (to form "scum") because the equilibrium constant for complex-ion formation is large, viz: 2+ +4 Were one to add 5.000 mL of 0.0613-MNa4(O;POPOs) to 25.00 mL of 0.0115-M Ca(NO,)2 calculate (i) the mmols of Ca2 ions that remain...
Correct answer is .0114 mols and 3.95%
Need full explanation on how to get there please!
III. Adding a complexing agent such as pyrophosphate (OsPOPOs) or triphosphate (P,010) to detergents prevents the magnesium and calcium salts found in "hard" water from precipitating (to form "scum") because the equilibrium constant for complex-ion formation is large, viz: 2+ +4 Were one to add 5.000 mL of 0.0613-MNa4(O;POPOs) to 25.00 mL of 0.0115-M Ca(NO,)2 calculate (i) the mmols of Ca2 ions that remain...
 please answer all the questions and explain and write
clearly
what do you mean this is all the complete question I have
there is nothing else
You are interested in studying the neurological effects of dehydrogenated brominate oil, a food additive. You randomly select 25 Sprague-Dawley rats and add a dosage to their drinking water. Because the additive is odorless and colorless, the rats readily consume it. After six months you sacrifice the rats, microsection their brains and count the...
please answer all the questions and explain and write
clearly
what do you mean this is all the complete question I have
there is nothing else
You are interested in studying the neurological effects of dehydrogenated brominate oil, a food additive. You randomly select 25 Sprague-Dawley rats and add a dosage to their drinking water. Because the additive is odorless and colorless, the rats readily consume it. After six months you sacrifice the rats, microsection their brains and count the...
 10. Match each description to the correct confidence interval in the diagram below. Must get all matches correct. No partial credit. Fail to reject H. P> 0.05. Not statistically significant despite large sample size, which justifies acceptance of the null hypothesis (Cl captures 1 because the RR estimate is close to 1). Fall to reject H. P> 0.05. Although the RR estimate is close to 1, we cannot accept the null hypothesis since the Ci is wide (imprecise). Cannot distinguish...
 need help with discrete math HW, please write solutions clearly,
and please don't give random answer if you're not sure cus then i
will need to post the same question twice. i appreciate every help
i can get but please let someone else help me solve the question if
you're not sure about any part to avoid reposting. thanks, will
rate best answer.
Let G be the set of 4 x 4 invertible real matrices and let - be matrix...
need help with discrete math HW, please write solutions clearly,
and please don't give random answer if you're not sure cus then i
will need to post the same question twice. i appreciate every help
i can get but please let someone else help me solve the question if
you're not sure about any part to avoid reposting. thanks, will
rate best answer.
Let G be the set of 4 x 4 invertible real matrices and let - be matrix...
 please give correct answer 100% please make sure hand writing is
clear and easy to read. please help me explain clearly the answer
given because i need to understand.
Find the magnitude and arguments of: a) Z1 7 - 12i b) Z2=-1 i
please give correct answer 100% please make sure hand writing is
clear and easy to read. please help me explain clearly the answer
given because i need to understand.
Find the magnitude and arguments of: a) Z1 7 - 12i b) Z2=-1 i
 please answer the following question for the given data
TN eCampus myOmegaFi I Login Citrix Receiver D Quality Book Q Physics II Midterm 6-8 t:1:41:55 Andrew Adcock: Attempt 1 Question 2 (6 points) From the data provided below and a subgroup size of 5, the trial upper control limit for the trial s-chart is most nearly what integer value? Obs Xbarstd dev 513 25 76 30 681506027503401857 686 43 - st 2 1 2 2 2 4 3 2 1...
please answer the following question for the given data
TN eCampus myOmegaFi I Login Citrix Receiver D Quality Book Q Physics II Midterm 6-8 t:1:41:55 Andrew Adcock: Attempt 1 Question 2 (6 points) From the data provided below and a subgroup size of 5, the trial upper control limit for the trial s-chart is most nearly what integer value? Obs Xbarstd dev 513 25 76 30 681506027503401857 686 43 - st 2 1 2 2 2 4 3 2 1...
 Please explain clearly why the answer is correct
Which of these "curved arrows" describe a mechanism for the formation of a carbocation that has roughly the same stability as this one? HHH - H- C- C 70-I CH H H-C-H Н AA only [B] B only [C] C only [D] B and C only [E] A and C only Explanation for your choice (4 pts)
Please explain clearly why the answer is correct
Which of these "curved arrows" describe a mechanism for the formation of a carbocation that has roughly the same stability as this one? HHH - H- C- C 70-I CH H H-C-H Н AA only [B] B only [C] C only [D] B and C only [E] A and C only Explanation for your choice (4 pts)
 please answer and explain why the answer is the correct answer
and how you figured it out
Free response Practice Guide Review pages 115-177 A 1.0L sample of a pure gas was found to have a lower pressure than that predicted by the ideal gas law. The best explanation for the observation is that molecules of the gas A. Have a combined volume that is too large to be considered negligible when compared to the volume of the container. B....
please answer and explain why the answer is the correct answer
and how you figured it out
Free response Practice Guide Review pages 115-177 A 1.0L sample of a pure gas was found to have a lower pressure than that predicted by the ideal gas law. The best explanation for the observation is that molecules of the gas A. Have a combined volume that is too large to be considered negligible when compared to the volume of the container. B....
Most questions answered within 3 hours.
-
When 60.1 gg of calcium is reacted with nitrogen gas, 31.7 gg of
calcium nitride is...
asked 1 minute ago -
The random variable X is exponentially distributed, where X
represents the time it takes for a...
asked 16 minutes ago -
a) Write a verilog module for 1:4 Demultiplexer using verilog
primitives.
b) Design 1-to-4 DEMUX using...
asked 10 minutes ago -
MATLAB
write a MATLAB function (1) output a third-order polynomial
function with the coefficients as the...
asked 23 minutes ago -
A z-score
communicates a raw score’s "relative standing"
under the normal curve in relation to:
asked 32 minutes ago -
An object is vibrating on a spring with the following equation
of motion:
?=(30 ??)cos((2?)/(160)?)
a)...
asked 31 minutes ago -
Vulcan Flyovers offers scenic overflights of Mount St. Helens,
the volcano in Washington State that explosively...
asked 34 minutes ago -
If organizations do not adapt fast enough and move incrementally
from the twentieth-century model to the...
asked 34 minutes ago -
A helium balloon with 2.5L of gas has a gauge pressure of 10,000
Pa. The balloon...
asked 39 minutes ago -
What is responsible for Jupiter's enormous magnetic field?
asked 54 minutes ago -
At the end of the year, a company offered to buy 5,000 units of
a product...
asked 55 minutes ago -
Implement C++ program for each of the following.
Let D = [-48, -14, -8, 0, 1,...
asked 1 hour ago