draw graphs of each market structure using the following
information: profit maximizing level of output 400 price at
$100

Homework Answers
Refer the attached picture below

Now refer the attached picture for the monopoly
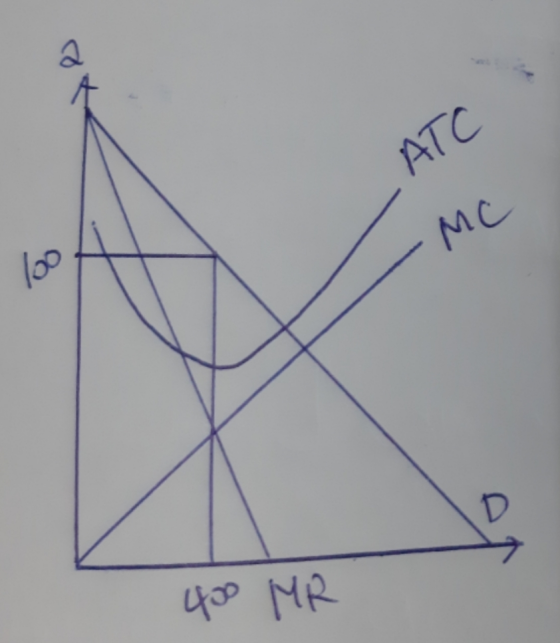
In all cases that is monopoly, oligopoly and monopolistic the graph would be similar as all the market structures the firms maximizes profit at MR = MC. Thus, same graph would be applicable to all.
Add Answer to:
draw graphs of each market structure using the following
information: profit maximizing level of output 400...
II.A. Identify and label the profit-maximizing level of output (Q) that will be pursued by this...
 II.A. Identify and label the profit-maximizing level of output (Q) that will be pursued by this 'monopolistic' firm. (5 Points) $$ MC ATC AVC Market Demand Output(Q) MR II.B. Draw and label the rectangle that represents the Total Revenue (TR) generated by this 'monopolistic' firm. (5 Points) $$ MC ATC AVC Market Demand -Output(Q) MR II.C. Draw and label the rectangles that represent Total Cost (TC), Total Fixed Cost (TFC) and Total Variable Cost (TVC) generated by this ‘monopolistic' firm....
1. Draw two graphs. On the first, show the short-run profit maximizing output of an individual...
1. Draw two graphs. On the first, show the short-run profit maximizing output of an individual firm earning an economic profit, including MR, MC, AVC, and ATC. On the second, show the short-run market equilibrium price and quantity. Explain how the industry supply curve and the market equilibrium price and quantity are determined. 2. What is the relationship between the price on the two graphs? Why does this relationship exist? 3. Explain why a firm in a perfectly competitive industry...
Which of the following options best describes market structures from the lowest to the highest degree...
Which of the following options best describes market structures from the lowest to the highest degree of market power? Perfect competition, monopolistic competition, oligopoly, monopoly Oligopoly, monopoly, monopolistic competition, perfect competition Monopoly, perfect competition, oligopoly, monopolistic competition Monopolistic competition, oligopoly, monopoly, perfect competition A cable company has determined that the marginal revenue from an additional subscriber is $15, and the marginal cost of providing cable services is $5. Based on this information, what should the company do? Increase the quantity...
Question 49 1 pts Dollars per unit MC $40 36 ATC 32 28 24 20 16...
 Question 49 1 pts Dollars per unit MC $40 36 ATC 32 28 24 20 16 D MR = AR ン/AVC 12 4 100 150 200 250 Quantity This diagram most likely represents what market structure? could represent all excent a perfect.competition AA itEN i 28 D MR = A 24 AVC 20 16 12 150 100 200 250 Quantity This diagram most likely represents what market structure? could represent all except a. perfect competition oligopoly monopolistic competition perfect competition...
Under which market structure can the firms make more than normal profit? pure competition and monopolistic...
Under which market structure can the firms make more than normal profit? pure competition and monopolistic competition oligopoly and monopoly monopolistic competition and oligopoly pure competition and monopoly Suppose that there are three firms in an industry, and their market shares are respectively 10%, 30%, and, and 60%. Then the Herfindahl index for this industry is: 1,000 3,400 3,600 4,600 Under which market structure is the non-price competition common? Monopolistic competition and oligopoly Oligopoly and monopoly Pure competition and monopolistic...
Figure: A Profit-Maximizing Monopoly Firm Reference: Ref 13-2 Figure: A Profit-Maximizing Monopoly Firm (Figure: A Profit-Maximizing...
 Figure: A Profit-Maximizing Monopoly Firm
Reference: Ref 13-2 Figure: A Profit-Maximizing Monopoly
Firm
(Figure: A Profit-Maximizing Monopoly Firm) Use Figure: A
Profit-Maximizing Monopoly Firm. This firm's cost per unit at its
profit-maximizing quantity is:
Select one:
a. $8.
b. $20.
c. $15.
d. $18.
We were unable to transcribe this imageP, MR MC, ATC $50 MC ATC 100 150 200 250 300 400 Quantity of output (per week) Reference: Ref 13-2 Figure: A Profit-Maximizing Monopoly Firm (Figure: A Profit-Maximizing Monopoly...
Figure: A Profit-Maximizing Monopoly Firm
Reference: Ref 13-2 Figure: A Profit-Maximizing Monopoly
Firm
(Figure: A Profit-Maximizing Monopoly Firm) Use Figure: A
Profit-Maximizing Monopoly Firm. This firm's cost per unit at its
profit-maximizing quantity is:
Select one:
a. $8.
b. $20.
c. $15.
d. $18.
We were unable to transcribe this imageP, MR MC, ATC $50 MC ATC 100 150 200 250 300 400 Quantity of output (per week) Reference: Ref 13-2 Figure: A Profit-Maximizing Monopoly Firm (Figure: A Profit-Maximizing Monopoly...
Based on the level of output being produced, is this firm maximizing profit? What is the dollar...
 Based on the level of output being produced, is this firm
maximizing profit? What is the dollar value of the
profit being earned by the firm? Use the lettering on
the graph to identify the area of profit.
How does the demand curve let you know this is a firm operating
in perfect competition?
What is the significance of Point E? Point F?
How much additional cost did the 500thunit add to
total cost? How do you know?
Explain how the market will adjust...
Based on the level of output being produced, is this firm
maximizing profit? What is the dollar value of the
profit being earned by the firm? Use the lettering on
the graph to identify the area of profit.
How does the demand curve let you know this is a firm operating
in perfect competition?
What is the significance of Point E? Point F?
How much additional cost did the 500thunit add to
total cost? How do you know?
Explain how the market will adjust...
must follow apa guidelines Select an industry or firm. State its market structure (pure competition, monopoly,...
 must follow apa guidelines
Select an industry or firm. State its market structure (pure competition, monopoly, monopolistic, or oligopoly). Next, please define the characteristics of the industry or firm that support your selection of market structure Lastly, describe and illustrate graphically the firm's profit maximizing behavior in particular MR-MC under the above-mentioned market structures or conditions.
must follow apa guidelines
Select an industry or firm. State its market structure (pure competition, monopoly, monopolistic, or oligopoly). Next, please define the characteristics of the industry or firm that support your selection of market structure Lastly, describe and illustrate graphically the firm's profit maximizing behavior in particular MR-MC under the above-mentioned market structures or conditions.
Perfect Competition Competition Monopolistic Monopoly Oligopoly Goal of firmsMaximize Profit Rule...
 how would you fill out this graph?
Perfect Competition Competition Monopolistic Monopoly Oligopoly Goal of firmsMaximize Profit Rule for maximizing profit MR-MC Can earn economic profits in the short run? Yes Can earn economic profits in the long run? Yes Price taker? Sometimes P2MC Sometimes Price & MC Produces welfare maximizing output? Number of firms? Few 3. (1 point) Consider a world where only blank t-shirts are produced. Draw hypothetical Demand faced by a firm, MR, MC, and ATC curves...
how would you fill out this graph?
Perfect Competition Competition Monopolistic Monopoly Oligopoly Goal of firmsMaximize Profit Rule for maximizing profit MR-MC Can earn economic profits in the short run? Yes Can earn economic profits in the long run? Yes Price taker? Sometimes P2MC Sometimes Price & MC Produces welfare maximizing output? Number of firms? Few 3. (1 point) Consider a world where only blank t-shirts are produced. Draw hypothetical Demand faced by a firm, MR, MC, and ATC curves...
10. The monopoly firm's profit-maximizing price is: determined for the quantity of output at which MR...
 10. The monopoly firm's profit-maximizing price is: determined for the quantity of output at which MR > MC by the greatest amount. given by the point on the ATC curve for the profit-maximizing quantity. given by the point on the demand curve for the profit-maximizing quantity. found where MR > MC at the monopolist's profit-maximizing quantity of output.
 II.A. Identify and label the profit-maximizing level of output (Q) that will be pursued by this 'monopolistic' firm. (5 Points) $$ MC ATC AVC Market Demand Output(Q) MR II.B. Draw and label the rectangle that represents the Total Revenue (TR) generated by this 'monopolistic' firm. (5 Points) $$ MC ATC AVC Market Demand -Output(Q) MR II.C. Draw and label the rectangles that represent Total Cost (TC), Total Fixed Cost (TFC) and Total Variable Cost (TVC) generated by this ‘monopolistic' firm....
 Question 49 1 pts Dollars per unit MC $40 36 ATC 32 28 24 20 16 D MR = AR ン/AVC 12 4 100 150 200 250 Quantity This diagram most likely represents what market structure? could represent all excent a perfect.competition AA itEN i 28 D MR = A 24 AVC 20 16 12 150 100 200 250 Quantity This diagram most likely represents what market structure? could represent all except a. perfect competition oligopoly monopolistic competition perfect competition...
 Figure: A Profit-Maximizing Monopoly Firm
Reference: Ref 13-2 Figure: A Profit-Maximizing Monopoly
Firm
(Figure: A Profit-Maximizing Monopoly Firm) Use Figure: A
Profit-Maximizing Monopoly Firm. This firm's cost per unit at its
profit-maximizing quantity is:
Select one:
a. $8.
b. $20.
c. $15.
d. $18.
We were unable to transcribe this imageP, MR MC, ATC $50 MC ATC 100 150 200 250 300 400 Quantity of output (per week) Reference: Ref 13-2 Figure: A Profit-Maximizing Monopoly Firm (Figure: A Profit-Maximizing Monopoly...
Figure: A Profit-Maximizing Monopoly Firm
Reference: Ref 13-2 Figure: A Profit-Maximizing Monopoly
Firm
(Figure: A Profit-Maximizing Monopoly Firm) Use Figure: A
Profit-Maximizing Monopoly Firm. This firm's cost per unit at its
profit-maximizing quantity is:
Select one:
a. $8.
b. $20.
c. $15.
d. $18.
We were unable to transcribe this imageP, MR MC, ATC $50 MC ATC 100 150 200 250 300 400 Quantity of output (per week) Reference: Ref 13-2 Figure: A Profit-Maximizing Monopoly Firm (Figure: A Profit-Maximizing Monopoly...
 Based on the level of output being produced, is this firm
maximizing profit? What is the dollar value of the
profit being earned by the firm? Use the lettering on
the graph to identify the area of profit.
How does the demand curve let you know this is a firm operating
in perfect competition?
What is the significance of Point E? Point F?
How much additional cost did the 500thunit add to
total cost? How do you know?
Explain how the market will adjust...
Based on the level of output being produced, is this firm
maximizing profit? What is the dollar value of the
profit being earned by the firm? Use the lettering on
the graph to identify the area of profit.
How does the demand curve let you know this is a firm operating
in perfect competition?
What is the significance of Point E? Point F?
How much additional cost did the 500thunit add to
total cost? How do you know?
Explain how the market will adjust...
 must follow apa guidelines
Select an industry or firm. State its market structure (pure competition, monopoly, monopolistic, or oligopoly). Next, please define the characteristics of the industry or firm that support your selection of market structure Lastly, describe and illustrate graphically the firm's profit maximizing behavior in particular MR-MC under the above-mentioned market structures or conditions.
must follow apa guidelines
Select an industry or firm. State its market structure (pure competition, monopoly, monopolistic, or oligopoly). Next, please define the characteristics of the industry or firm that support your selection of market structure Lastly, describe and illustrate graphically the firm's profit maximizing behavior in particular MR-MC under the above-mentioned market structures or conditions.
 how would you fill out this graph?
Perfect Competition Competition Monopolistic Monopoly Oligopoly Goal of firmsMaximize Profit Rule for maximizing profit MR-MC Can earn economic profits in the short run? Yes Can earn economic profits in the long run? Yes Price taker? Sometimes P2MC Sometimes Price & MC Produces welfare maximizing output? Number of firms? Few 3. (1 point) Consider a world where only blank t-shirts are produced. Draw hypothetical Demand faced by a firm, MR, MC, and ATC curves...
how would you fill out this graph?
Perfect Competition Competition Monopolistic Monopoly Oligopoly Goal of firmsMaximize Profit Rule for maximizing profit MR-MC Can earn economic profits in the short run? Yes Can earn economic profits in the long run? Yes Price taker? Sometimes P2MC Sometimes Price & MC Produces welfare maximizing output? Number of firms? Few 3. (1 point) Consider a world where only blank t-shirts are produced. Draw hypothetical Demand faced by a firm, MR, MC, and ATC curves...
 10. The monopoly firm's profit-maximizing price is: determined for the quantity of output at which MR > MC by the greatest amount. given by the point on the ATC curve for the profit-maximizing quantity. given by the point on the demand curve for the profit-maximizing quantity. found where MR > MC at the monopolist's profit-maximizing quantity of output.
Most questions answered within 3 hours.
-
Write a program to solve the Josephus problem, with the following
modification:
Sample Input:
./a.out n...
asked 1 hour ago -
At the start of a CD it is spinning at a rate of 525 rpm
(revolutions...
asked 1 hour ago -
4. Without doing any calculations, predict whether the observed
∆T would increase, decrease or remain the...
asked 2 hours ago -
Based on the range, which of the following sets of scores has
the greatest variability? 3,...
asked 3 hours ago -
Ripples in a pond travel at a velocity of 3 m/s with one peak
passing a...
asked 3 hours ago -
A man stands on the roof of a building of height 13.0 mm and
throws a...
asked 3 hours ago -
The extent to which assets are financed by borrowed funds and
other liabilities is indicated by:...
asked 4 hours ago -
Explain in detail
Germany is the fifth largest economy
explain what goods and services Germany specializes...
asked 5 hours ago -
The density of platinum is 21.45 g/mL. If a cube of platinum
with a mass of...
asked 5 hours ago -
Accounts Receivable
Sales
A/R Posting
Extended Sales Invoice
Packing Slip
Compare invoice to packing slip 2...
asked 5 hours ago -
Michaella, age 23, is a full-time law student and is claimed by
her parents as a...
asked 5 hours ago -
Why are polymers not typically casted into products?
asked 5 hours ago