
Homework Answers


note, that, option(d) is followed by option(e).
Add Answer to:
In a sample of 20 students enrolled in a hybrid course one that contains both online...
Software instruction: A hybrid course is one that contains both online and classroom instruction. In a...
 Software instruction: A hybrid course is one that contains both online and classroom instruction. In a study performed at Middle Georgia State College, a software package was used as the main source of instruction in a hybrid college algebra course. The software tracked the number of hours it took for each student to meet the objectives of the course. In a sample of 44 students, the mean number of hours was 80.5, with a standard deviation of 51.4. Part: 0/2...
ATH241 23 In a sam standard deviation of 39.2. a.) What is the best point estimate...
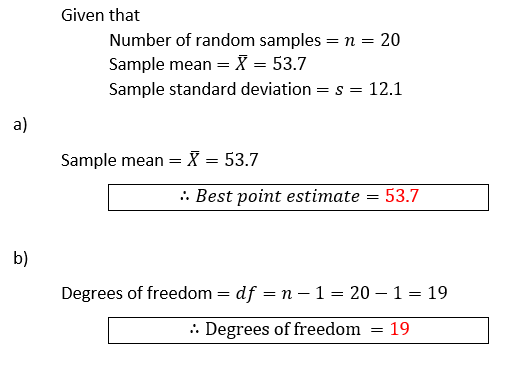
 ATH241 23 In a sam standard deviation of 39.2. a.) What is the best point estimate of the mean number of hours it takes students to meet online course ple of 42 students enrolled in a hybrid course (one that contains both online and classroom ). the mean number of hours it took students to meet the online course objectives was 71 8 with a objectives? b.) How many degrees of freedom will be used for the given sample size?...
An admissions director wants to estimate the mean age of all students enrolled at a college....
 An admissions director wants to estimate the mean age of all students enrolled at a college. The estimate must be within 1.5 years of the population mean. Assume the population of ages is normally distributed. (a) Determine the minimum sample size required to construct a 90% confidence interval for the population mean. Assume the population standard deviation is 1.6 years. (b) The sample mean is 20 years of age. Using the minimum sample size with a 90% level of confidence,...
A department of education reported that in 2007, 68% of students enrolled in college or a...
 A department of education reported that in 2007, 68% of students enrolled in college or a trade school within 12 months of graduating from high school. In 2013, a random sample of 160 individuals who graduated from high school 12 months prior was selected. From this sample, 106 students were found to be enrolled in college or a trade school. Complete parts a through c below. a. Construct a 90% confidence interval to estimate the actual proportion of students enrolled...
A department of education reported that in 2007, 63% of students enrolled in college or a...
A department of education reported that in 2007, 63% of students enrolled in college or a trade school within 12 months of graduating from high school. In 2013, a random sample of 320 individuals who graduated from high school 12 months prior was selected. From this sample, 204 students were found to be enrolled in college or a trade school. Complete parts a through c below. a. Construct a 90% confidence interval to estimate the actual proportion of students enrolled...
A sample of 250 students who were taking online courses were asked to describe their overall...
A sample of 250 students who were taking online courses were asked to describe their overall impression of online learning on a scale of 1-7 with 7 representing the most favorable impression. The average score was 4.98 and the standard deviation was 0.87. Construct a 90% confidence interval for the mean score. Round your final answers to 3 decimal places. The 90% confidence interval for the mean score is: ( , )
Fifty students are enrolled in an Economics class. After the first examination, a random sample of...
Fifty students are enrolled in an Economics class. After the first examination, a random sample of five papers was selected. The grades were 60, 70, 75, 80, 90. a. Calculate the estimate of the standard error of the mean. b. What assumption must be made before we can determine an interval for the mean grade of all the students in the class? Explain why? c. Assume the assumption of part(b) is met. Provide a 90% confidence interval for the mean...
Suppose that 37% of ONU students have taken an online course. A random sample of...
Suppose that 37% of ONU students have taken an online course. A random sample of 200 ONU students is taken, of which 78 have taken an online course. What is the probability of obtaining a sample proportion this high or higher? There is some thought that the proportion taking online courses is no longer 37%. Based on the random sample, construct a 95% confidence interval for the proportion of ONU students who have taken an online course. ...
A college admissions director wishes to estimate the mean age of all students currently enrolled. In...
A college admissions director wishes to estimate the mean age of all students currently enrolled. In a random sample of 16 students, the mean age is found to be 21.8 years. From past studies, the ages of enrolled students are normally distributed with a standard deviation of 10.1 years. Construct a 90% confidence interval for the mean age of all students currently enrolled. 1. The critical value: 2. The standard deviation of the sample mean: 3. The margin of error:...
A college admissions director wishes to estimate the mean age of all students currently enrolled. In...
A college admissions director wishes to estimate the mean age of all students currently enrolled. In a random sample of 24 students, the mean age is found to be 23.1 years. From past studies, the ages of enrolled students are normally distributed with a standard deviation of 10.6 years. Construct a 90% confidence interval for the mean age of all students currently enrolled. 1. The critical value: 2. The standard deviation of the sample mean: 3. The margin of error:...
 Software instruction: A hybrid course is one that contains both online and classroom instruction. In a study performed at Middle Georgia State College, a software package was used as the main source of instruction in a hybrid college algebra course. The software tracked the number of hours it took for each student to meet the objectives of the course. In a sample of 44 students, the mean number of hours was 80.5, with a standard deviation of 51.4. Part: 0/2...
 ATH241 23 In a sam standard deviation of 39.2. a.) What is the best point estimate of the mean number of hours it takes students to meet online course ple of 42 students enrolled in a hybrid course (one that contains both online and classroom ). the mean number of hours it took students to meet the online course objectives was 71 8 with a objectives? b.) How many degrees of freedom will be used for the given sample size?...
 An admissions director wants to estimate the mean age of all students enrolled at a college. The estimate must be within 1.5 years of the population mean. Assume the population of ages is normally distributed. (a) Determine the minimum sample size required to construct a 90% confidence interval for the population mean. Assume the population standard deviation is 1.6 years. (b) The sample mean is 20 years of age. Using the minimum sample size with a 90% level of confidence,...
 A department of education reported that in 2007, 68% of students enrolled in college or a trade school within 12 months of graduating from high school. In 2013, a random sample of 160 individuals who graduated from high school 12 months prior was selected. From this sample, 106 students were found to be enrolled in college or a trade school. Complete parts a through c below. a. Construct a 90% confidence interval to estimate the actual proportion of students enrolled...
Most questions answered within 3 hours.
-
Linear programming is an excellent technique yet is not applied
nearly enough in the “real world.”...
asked 6 minutes ago -
What three alkenes yield 3-methylpentane on catalytic
hydrogenation?
asked 6 minutes ago -
In JAVA Create a program with an array with the following
data:
50 12 31 76...
asked 8 minutes ago -
Using a hormone of the hypothalamic-anterior pituitary axis,
describe or diagram how negative feedback loops regulate...
asked 6 minutes ago -
1,1-dimethylcyclorohexane reacts with single bromine atom
asked 30 minutes ago -
The completed Lewis structure of CO2 contains a total
of 0,1,2,3,4,5,6,7,8 covalent bonds
and 0,1,2,3,4,5,6,7,8 lone pairs.
NOTE:...
asked 36 minutes ago -
A 0.0510 M solution of an organic acid has an
[H+] of 7.50×10⁻⁴M .
What is...
asked 33 minutes ago -
what is the profit-maximizing output condition that a
monopolistically competitive firm must satisfy? a) price charged...
asked 38 minutes ago -
Consider the set of ordered pairs shown below. Assuming that the
regression equation is y=3.513+0.429x and...
asked 59 minutes ago -
1. (A) Write two
structural (constitutional)
isomers of C4H8F2?
Please show all of
the
asked 1 hour ago -
Objective: Practice converting a Boolean logic
expression into it’s truth table and to show the implementation...
asked 58 minutes ago -
1) Name the three holes located in the greater wing of the
sphenoid bone in order...
asked 1 hour ago