
Homework Answers
 (D) the data shape is
not any sepcific ,but the graph below
(D) the data shape is
not any sepcific ,but the graph below
3,2 The ollowing set of data is from a sample of n - 6: 74973 12...
 3,2 The ollowing set of data is from a sample of n - 6: 74973 12 a. Compute the mean, median, and mode. b. Compute the range, variance, standard deviation, and coeffi- cient of variation. c. Compute the Z scores. Are there any outliers? d. Describe the shape of the data set.
The following is a set of data from a sample of n=5. 8 -4 -8 8...
 The following is a set of data from a sample of n=5. 8 -4 -8 8 2 Please use a statistical application (data Analysis Toolpak for Windows, StatPlus for Mac Excel, or StatCrunch) to compute the descriptive statistics in a and b. (If you don't know what I'm talking about, go to Module 1 Content - Read/View - Tutorials) a. Compute the mean, median, and mode. b. Compute the range, sample variance, and sample standard deviation c. Compute the coefficient...
1. The following set of data is from a sample of n = 7: 3 14...
1. The following set of data is from a sample of n = 7: 3 14 11 6 2 14 13 A. Compute the range, variance, standard deviation, and coefficient of variation. B. Compute the Z score for each observation. Assuming a Z-score of 2 or greater represents an outlier, are there any outliers in this data set?
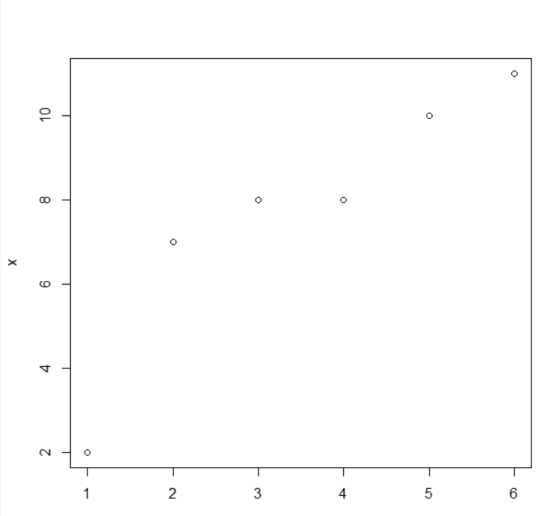
The following set of data is from a sample of n=6. 7, 10, 9, 7, 8,...
The following set of data is from a sample of n=6. 7, 10, 9, 7, 8, 12 a. Compute the mean, median, and standard deviation. (Round to two decimal places as needed.) b. What is the shape of the dataset? Why?
> Question 8 5 pts The following set of data is from a sample of n=6....
 > Question 8 5 pts The following set of data is from a sample of n=6. 7, 10, 9, 7, 8, 12 a. Compute the mean, median, and standard deviation. (Round to two decimal places as needed.) b. What is the shape of the dataset? Why? Upload Choose a file
(2) Consider the sample: 9, 6. 7, 9, 10, 8 a) Find: the mean, the median,...
 (2) Consider the sample: 9, 6. 7, 9, 10, 8 a) Find: the mean, the median, the mode b) Find: the range, the quartiles Q1, Q3, the variance, the standard deviation c) Draw a box-plot for the given data set.
Consider the sample: 9, 6, 7, 9, 10, 8 a) Find : the mean, the median,...
Consider the sample: 9, 6, 7, 9, 10, 8 a) Find : the mean, the median, the mode b) Find : the range, the quartiles Q1, Q3, the variance, the standard deviation. c) Draw a box-plot for the given data set.
The data set below contains penetration values (the percentage of a country's population who are users)...
 The data set below contains penetration values (the percentage of a country's population who are users) for a popular website in 22 of the world's largest economies. Complete parts (a) through (d) below. 42 39 27 44 42 28 516 24 51 33 9 6 80 23 34 58 42 19 57 51 57 OB. There is no mode for this data set. b. Calculate the variance, standard deviation, range, coefficient of variation, and Z scores. Are there any outliers?...
2. The data set below is a sample of the Mathematics test scores of 10 students:...
2. The data set below is a sample of the Mathematics test scores of 10 students: 56, 96, 78, 67, 60, 69, 85, 90, 89, 72 (a) Find the mean and median of the given test scores. (b) Is there a mode value for these scores? Why or why not? (c) Find the range and standard deviation (nearest hundredth) of these scores. (d) Find the percentile rank of 78 (e) What percent of these scores are within 1 standard deviation...
1. You are given the following sample of scores: 5, 6, 7, 8, 9, 9, 10,...
1. You are given the following sample of scores: 5, 6, 7, 8, 9, 9, 10, 10, 11, 25 (a) For the sample above, calculate (show all of your work): (i) the mean (ii) the median (iii) the mode (iv) the variance (v) the standard deviation (vi) What do the variance and standard deviation represent? (b) Which raw score in the above sample most closely corresponds to a z-score of –0.7? (c) If Dr. Jones states that the mean is...
 3,2 The ollowing set of data is from a sample of n - 6: 74973 12 a. Compute the mean, median, and mode. b. Compute the range, variance, standard deviation, and coeffi- cient of variation. c. Compute the Z scores. Are there any outliers? d. Describe the shape of the data set.
 The following is a set of data from a sample of n=5. 8 -4 -8 8 2 Please use a statistical application (data Analysis Toolpak for Windows, StatPlus for Mac Excel, or StatCrunch) to compute the descriptive statistics in a and b. (If you don't know what I'm talking about, go to Module 1 Content - Read/View - Tutorials) a. Compute the mean, median, and mode. b. Compute the range, sample variance, and sample standard deviation c. Compute the coefficient...
 > Question 8 5 pts The following set of data is from a sample of n=6. 7, 10, 9, 7, 8, 12 a. Compute the mean, median, and standard deviation. (Round to two decimal places as needed.) b. What is the shape of the dataset? Why? Upload Choose a file
 (2) Consider the sample: 9, 6. 7, 9, 10, 8 a) Find: the mean, the median, the mode b) Find: the range, the quartiles Q1, Q3, the variance, the standard deviation c) Draw a box-plot for the given data set.
 The data set below contains penetration values (the percentage of a country's population who are users) for a popular website in 22 of the world's largest economies. Complete parts (a) through (d) below. 42 39 27 44 42 28 516 24 51 33 9 6 80 23 34 58 42 19 57 51 57 OB. There is no mode for this data set. b. Calculate the variance, standard deviation, range, coefficient of variation, and Z scores. Are there any outliers?...
Most questions answered within 3 hours.
-
What percent of revenue does net income represent for each
year?
Total Revenue
2017 = 60,319,000...
asked 16 minutes ago -
For Ti+2 (Z=22). Determine the correct ground state
& # of microstates. Use the correct tanabe...
asked 20 minutes ago -
Why did so many investment banks have to start buying CDO’s and
other mortgaged backed securities...
asked 35 minutes ago -
The mean cost of domestic airfares in the United States rose to
an all-time high of...
asked 46 minutes ago -
1.Magazine Luiza is a Brazilian retail chain for consumer
electronics. The company currently has 100 stores...
asked 44 minutes ago -
What is the molarity of ZnCl2 that forms when 25.0 g of zinc
completely reacts with...
asked 46 minutes ago -
For independent X and Y, we have probability density function
for them where pdf of X...
asked 57 minutes ago -
The decomposition of SO2Cl2 is first order in SO2Cl2 and has a
rate constant of 1.42...
asked 53 minutes ago -
How do I convert from volume percent to mole percent in the
distillation lab? ethy acetate...
asked 1 hour ago -
8. An air-plane has an effective wing surface area of 14.0 m²
that is generating the...
asked 1 hour ago -
A railroad worker was a person who worked on setting and moving
railroad tracks. In securing...
asked 59 minutes ago -
using RECURSIVE Functions in Java, create a public static String
doubleLetters (String word)
For ex) that...
asked 1 hour ago