
Homework Answers
Answer #1
1.
| Categorical System | weighted point method | Cost based system |
| The buyer chooses the attributes most important to it and assigns preferred (+), neutral (o) or unsatisfactory (-) rating to each attribute. all the ratings are then added and the supplier with maximum rating is chosen | The buyer chooses the attributes most important to it and give each attribute a weight. Then the supplier is rated for each attribute and performance score is given to each attribute. all the performance scores are then added to find the best supplier. | In this method the total cost of doing business with supplier is calculated by the supplier performance index. SPI= (Purchase Price + Nonperformance Cost) / (Purchase Price)). in this method all the cost that buyer may need to incur in supplier fails are also considered. |
| Easy to implement | Medium Complexity | Medium Complexity |
| A lot of subjectivity present in this method | Gives a lot of flexibility to change weights on attributes based on business strategy | Least subjective of the three as it quantifies total cost of doing business with supplier |
2. SPI = (Purchase Price + Nonperformance Cost) / (Purchase Price))
Purchase price= $79.95
number of unit= 120
total purchase price= 120*79.95=$9594
Nonperformance costs:
Late delivery = 9*35=$315
return to supplier= 5*19=$95
Scrap labor cost= 8*38=$304
testing and re-storage= 11*17=$187
total non performance cost= 315+95+304+187= $901
SPI= (9594+901)/9594=1.094
3.
| Total Weighted Score | |
| Supplier 1 | 7.235 |
| Supplier 2 | 7.605 |
Supplier 2 is most satisfactory Supplier as it has greater total weighted score value.
First calculate the weighted scores for each category: Quality , service and management
After that calculate the total weighted score by multiplying by the respected weight scores Quality 50% , service 35% and management 15%.
please find the pic below: 
here is the pic with all excel formula:
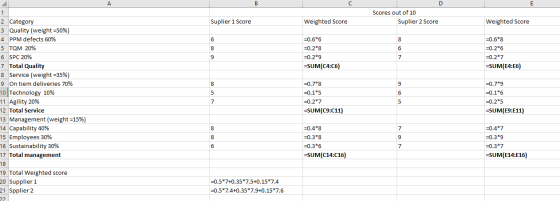
Scores out of 10 Suplier 1 Score Weighted Score Suplier 2 Score Weighted Score 4.8 1.2 3.6 1.6 1.8 1 1.4 7.4 2 Category 3 Quality (weight =50%) 4 PPM defects 60% 5 TOM 20% 6 SPC 20% 7 Total Quality 8 Service (weight =35%) 9 On tiem deliveries 70% 10 Technology 10% 11 Agility 20% 12 Total Service 13 Management (weight =15%) 14 Capability 40% 15 Employees 30% 16 Sustainability 30% 17 Total management 5.6 0.5 6.3 0.6 5 1 2.8 8 8 2.7 7.6 18 19 Total Weighted score 20 Supplier 1 21 Spplier 2 22 7.235 7.605
Scores out of 10 Suplier 2 Score Suplier 1 Score Weighted Score Weighted Score =0.6*6 =0.2*8 =0.2*9 =SUM(C4:06) =0.6*8 =0.2*6 =0.2*7 =SUM(E4:E6) 1 2 Category 3 Quality (weight =50%) 4 PPM defects 60% 5 TQM 20% 6 SPC 20% 7 Total Quality 8 Service (weight =35%) 9 On tiem deliveries 70% 10 Technology 10% 11 Agility 20% 12 Total Service 13 Management (weight =15%) 14 Capability 40% 15 Employees 30% 16 Sustainability 30% 17 Total management =0.7*8 =0.1*5 =0.2*7 =SUM(C9:011) =0.7*9 =0.1*6 =0.2*5 =SUM(E9:E11) =0.4*8 =0.3*8 =0.3*6 =SUM(C14:016) =0.4*7 =0.3*9 =0.3*7 =SUM(E14:E16) 6 19 Total Weighted score 20 Supplier 1 21 Spplier 2 =0.5*7+0.35*7.5+0.15*7.4 =0.5*7.4+0.35*7.9+0.15*7.6 22
Know the answer?
Add Answer to:
1. Describe a comparison of Supplier Measurement and Evaluation systems in a tabular form. 2. Cost-based...
Not the answer you're looking for?
Ask your own homework help question.
Our experts will answer your question WITHIN MINUTES for Free.
Similar Homework Help Questions
ADVERTISEMENT
Need Online Homework Help?
Ask
a QuestionGet Answers For Free
Most questions answered within 3 hours.
Most questions answered within 3 hours.
ADVERTISEMENT
ADVERTISEMENT
Active Questions
-
In Visual Basic 2017, Write a complete Main method that prints
Hello, world to the screen....
asked 1 minute ago -
a) Find the pressure difference on an airplane wing if air flows
over the upper surface...
asked 7 minutes ago -
Write an assessment of the current business analysis of Hilton
Worldwide using Porters 5 Forces analysis.
asked 18 minutes ago -
i need help on this
Chapter 9 Section 3 Question 1:
Rudy puts this poster, with...
asked 27 minutes ago -
True or false Assembly x86
41. _____ The program counter is a pointer to the
instruction....
asked 27 minutes ago -
You have conducted an experiment to try to demonstrate that
growth factor receptor X protein (GFRX)...
asked 42 minutes ago -
The Gross Profit ratio for 2014 is 57.07%
Assume that Campbell's net sales for the first...
asked 42 minutes ago -
Thoroughly discuss the various current and proposed solutions to
anthropogenic influences resulting in Global Climate Change....
asked 46 minutes ago -
BLOG EXERCISE: You are writing a weekly intranet blog for the
CEO of a large Canadian...
asked 49 minutes ago -
calculate ΔGrxn at 36 ∘C. N2O4(g)→2NO2(g)
asked 49 minutes ago -
Present and Future Values of Single Cash Flows for Different
Periods
Find the following values, using...
asked 52 minutes ago -
Which types of mutations in DNA can lead to the translation of a
non-functional protein product?...
asked 51 minutes ago
ADVERTISEMENT