
Homework Answers
(a) The war increases defense spending, raising government purchases. Price level and output both rise and unemployment falls.
(b) Aggregate demand (AD) curve will shift first, in the rightward direction. In following graph, AD0 and SRAS0 are initial aggregate demand & short run aggregate supply curves intersecting at point A with initial price level P0 and output Y0. As government spending rises, AD0 shifts right to AD1, intersecting SRAS0 at point B with higher price level P1 and higher output Y1.

(c) Since income and output will rise, unemployment will fall because labor demand will be higher. As labor demand rises, wage rate will increase.
(d) This will lead to higher real GDP, output and income in the economy along with higher inflation.
(e) The graph is drawn above.
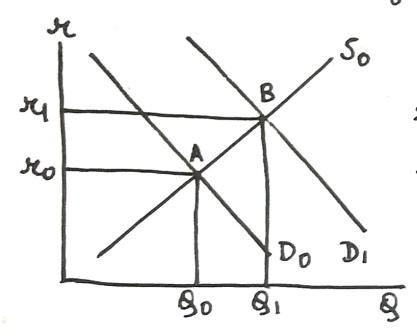
(b) Higher spending and lower tax will increase budget deficit, to finance which government will resort to borrowing. This will increase the demand for loanable funds, shifting the demand curve rightward, increasing both interest rate and the quantity of loanable funds. In following graph, D0 & S0 are initial demand & supply for loanable funds intersecting at point A with interest rate r0 and quantity of loanable funds Q0. As demand shifts right to D1, it intersects S0 at point B with higher interest rate r1 and higher quantity of loanable funds Q1.
Add Answer to:
4. The United States invaded Afghanistan on October 7th 2001 and Iraq on March 30th 2003....
FISCAL POLICY IN THEORY: March, 2020: we are on the verge of Congress and the President...
FISCAL POLICY IN THEORY: March, 2020: we are on the verge of Congress and the President passing legislation that will empower the federal government to spend an unprecedented amount of EXTRA money not seen since World War 2 ---- in order to address the pandemic but also to help cushion the blow financially of perhaps ten or twenty million Americans --- or more --- losing their jobs, and thus suffering a drop in income. The scale of the 2020 recession...
Most questions answered within 3 hours.
-
An MNE is this kind of industry when competition in one country
is essentially independent of...
asked 1 hour ago -
. For this set of questions, determine what
proportion of a normal distribution is located betweeneach...
asked 1 hour ago -
A college student is employed as a door-to-door newspaper
salesman. Historical data suggests that the student...
asked 2 hours ago -
MATLAB HW 11 problem using Switch Case and Input commands
Write a script file that calculates...
asked 2 hours ago -
Considering gravitational time dilation, calculate the time that
passes in Earth’s surface while 1 hour passes...
asked 2 hours ago -
Minitab Problem: Take the Lake Hume June rainfall data and find
use the processes outlined in...
asked 3 hours ago -
X Company is trying to decide whether to continue using old
equipment to make Product A...
asked 3 hours ago -
IN PYTHON ONLY !! Program 2: Re-work
program #5 (WeeklyHours) from the previous assignment such that...
asked 4 hours ago -
The average length of time between arrivals at a turnpike
toll-booth is 26 seconds. What is...
asked 6 hours ago -
(a) A piston at 6.1 atm contains a gas that occupies a volume of
3.5 L....
asked 7 hours ago -
Please answer true or false. Words
cannot be changed or added in to make it true...
asked 7 hours ago -
An empty test tube weighs 15.923 grams. Then,
MgCl2•6H2O is added into the test tube. After...
asked 7 hours ago