
Homework Answers

The six households below contain one mom, one dad, and either one or two children. The...
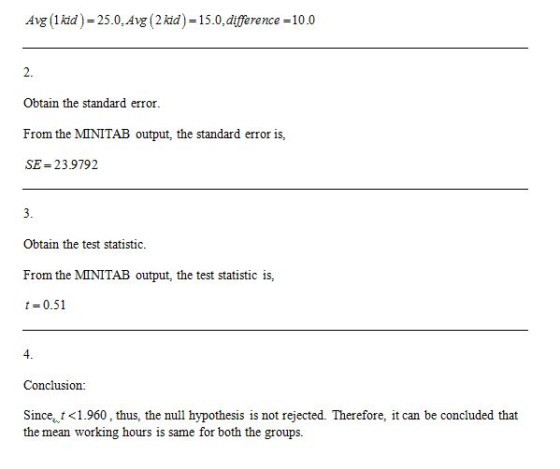
The six households below contain one mom, one dad, and either one or two children. The table below indicates the Census-assigned household number (for reference purposes; it is not used in this assignment), the number of children in the household, a two-child household indicator variable, and the number of hours the mom works in a typical week. household Number kids Two kids Mom's work hours 16761 2 1 0 24438 2 1 45 41729 2 1 0 42802 1 0...
Use the following to answer questions 1-4. The average house hold size in a certain region...
Use the following to answer questions 1-4. The average house hold size in a certain region several years ago was 3.14. A sociologist wishes to test, at 5% level of significance, whether it is different now. Perform the test using the information collected by the sociologist; in a random sample of 75 households, the average size was 2.98 persons, with sample standard deviation 0.82 persons. 1. Set up the null and alternative hypothesis to test the researcher’s claim. a. ?0:?=2.98...
Treatment 1 Treatment 2 Treatment 3 0 1 6 1 4 5 0 1 6 3...
Treatment 1 Treatment 2 Treatment 3 0 1 6 1 4 5 0 1 6 3 2 3 T = 4 T = 8 T = 20 SS = 6 SS = 6 SS = 6 N = 12 G = 32 ƩX2= 138 1a. Conduct a single-factor independent-measures ANOVA to test the hypothesis that there are significant differences in the mean scores among the three treatment conditions. Use α = .01. The alternative hypothesis is Group of answer choices...
1. You decide to test different samples for musical preferences: Baby Boomers, generation X and generation...
1. You decide to test different samples for musical preferences: Baby Boomers, generation X and generation Z. Which type of inferential method, or case, is most appropriate for this scenario? A. ANOVA B. Independent samples C. Matched pairs 2.You have been asked to study the driving habits of marital couples; those living in the same household as a married couple. You want to measure the speed of spouse 1 and the speed of spouse 2 with the same vehicle. You...
For either independent-measures or repeated-measures designs comparing two treatments, the mean difference can be evaluated with...
 For either independent-measures or repeated-measures designs comparing two treatments, the mean difference can be evaluated with either at test or an ANOVA. The two tests are related by the equation F=12. The following data are from a repeated-measures study: Person Difference Scores 3 I 4 2 3 7 M = 4.00 T = 16 SS = 14 Treatment II 7 11 6 10 M 8.50 T-34 SS = 17 3 3 Mo 4.50 SS = 27.00 Use a repeated-measures t...
Run a one sample t-test for HGHTI_P to test if the CHIS sample is significantly different...
Run a one sample t-test for HGHTI_P to test if the CHIS sample is significantly different from 68(the average height in the U.S.). What can you conclude based on the results of your test (Hint: what does the p-value tell you?)? Do you reject the null hypothesis, or fail to reject the null hypothesis? Does the CHIS sample population have a statistically significant different average height than 68 inches tall?
3. As with the previous homework, we want to compare the average decrease in PSI between the two ...
 3. As with the previous homework, we want to compare the average decrease in PSI between the two teams. Create a new column for decrease in PST, defined as PST Pregarne minus PST_Halftime. Use "Analyze Fit Y by X", select the appropriate variables (see the notes if you have trouble with this), hit "OK", then select "t Test" from the drop down menu on the next screen. The results that you ignored in the previous homework are the results of...
PART F PART i In 1955, Life Magazine reported that a 25-year-old mother of three worked,...
 PART F PART i
In 1955, Life Magazine reported that a 25-year-old mother of three worked, on average, an 80 hour week. Recently, many groups have been studying whether or not the women's movement has, in fact, resulted in an increase in the average work week for women (combining employment and at-home work). Suppose a study was done to determine if the mean work week has increased. 68 women were surveyed with the following results. The sample mean was 83;...
PART F PART i
In 1955, Life Magazine reported that a 25-year-old mother of three worked, on average, an 80 hour week. Recently, many groups have been studying whether or not the women's movement has, in fact, resulted in an increase in the average work week for women (combining employment and at-home work). Suppose a study was done to determine if the mean work week has increased. 68 women were surveyed with the following results. The sample mean was 83;...
In this problem, assume that the distribution of differences is approximately normal. Note: For degrees of...
In this problem, assume that the distribution of differences is approximately normal. Note: For degrees of freedom d.f. not in the Student's t table, use the closest d.f. that is smaller. In some situations, this choice of d.f. may increase the P-value by a small amount and therefore produce a slightly more "conservative" answer. Is fishing better from a boat or from the shore? Pyramid Lake is located on the Paiute Indian Reservation in Nevada. Presidents, movie stars, and people...
A comparison is made between two bus lines to determine if arrival times of their regular...
 A comparison is made between two bus lines to determine if
arrival times of their regular buses from Denver to Durango are off
schedule by the same amount of time. For 51 randomly selected runs,
bus line A was observed to be off schedule an average time of 53
minutes, with standard deviation 19minutes. For 61 randomly
selected runs, bus line B was observed to be off schedule an
average of 62 minutes, with standard deviation 15 minutes. Do the...
A comparison is made between two bus lines to determine if
arrival times of their regular buses from Denver to Durango are off
schedule by the same amount of time. For 51 randomly selected runs,
bus line A was observed to be off schedule an average time of 53
minutes, with standard deviation 19minutes. For 61 randomly
selected runs, bus line B was observed to be off schedule an
average of 62 minutes, with standard deviation 15 minutes. Do the...
 For either independent-measures or repeated-measures designs comparing two treatments, the mean difference can be evaluated with either at test or an ANOVA. The two tests are related by the equation F=12. The following data are from a repeated-measures study: Person Difference Scores 3 I 4 2 3 7 M = 4.00 T = 16 SS = 14 Treatment II 7 11 6 10 M 8.50 T-34 SS = 17 3 3 Mo 4.50 SS = 27.00 Use a repeated-measures t...
 3. As with the previous homework, we want to compare the average decrease in PSI between the two teams. Create a new column for decrease in PST, defined as PST Pregarne minus PST_Halftime. Use "Analyze Fit Y by X", select the appropriate variables (see the notes if you have trouble with this), hit "OK", then select "t Test" from the drop down menu on the next screen. The results that you ignored in the previous homework are the results of...
 PART F PART i
In 1955, Life Magazine reported that a 25-year-old mother of three worked, on average, an 80 hour week. Recently, many groups have been studying whether or not the women's movement has, in fact, resulted in an increase in the average work week for women (combining employment and at-home work). Suppose a study was done to determine if the mean work week has increased. 68 women were surveyed with the following results. The sample mean was 83;...
PART F PART i
In 1955, Life Magazine reported that a 25-year-old mother of three worked, on average, an 80 hour week. Recently, many groups have been studying whether or not the women's movement has, in fact, resulted in an increase in the average work week for women (combining employment and at-home work). Suppose a study was done to determine if the mean work week has increased. 68 women were surveyed with the following results. The sample mean was 83;...
 A comparison is made between two bus lines to determine if
arrival times of their regular buses from Denver to Durango are off
schedule by the same amount of time. For 51 randomly selected runs,
bus line A was observed to be off schedule an average time of 53
minutes, with standard deviation 19minutes. For 61 randomly
selected runs, bus line B was observed to be off schedule an
average of 62 minutes, with standard deviation 15 minutes. Do the...
A comparison is made between two bus lines to determine if
arrival times of their regular buses from Denver to Durango are off
schedule by the same amount of time. For 51 randomly selected runs,
bus line A was observed to be off schedule an average time of 53
minutes, with standard deviation 19minutes. For 61 randomly
selected runs, bus line B was observed to be off schedule an
average of 62 minutes, with standard deviation 15 minutes. Do the...
Most questions answered within 3 hours.
-
Question Three
Suppose you as project manager are using the Waterfall
development methodology on a large...
asked 43 minutes ago -
Which statement is not true about welfare in Canada?
A.Benefits typically vary based on one's ability...
asked 1 hour ago -
Please help me with FLOWCHART and UML diagram for class,
thank you!
#include <iostream>
#include <fstream>...
asked 2 hours ago -
3. Describe the “logic circuit” of the Lac operon. Which
proteins are bound or not to...
asked 2 hours ago -
Ayesha’s adjusted gross income is $60,000 in 2019. She donated a
piece of artwork with a...
asked 2 hours ago -
For Dijkstra’s shortest path algorithm:
a. Give the Big-O time for Dijkstra’s shortest path algorithm
and...
asked 2 hours ago -
Phosphorus violates the 'octet rule' in biological molecules,
forming more covalent bonds than expected based on...
asked 2 hours ago -
A 1.3 eV electron has a 10-4 probability of tunneling
through a 2.4 eV potential barrier....
asked 2 hours ago -
What is the one ingredient that is common to being successful
with all stakeholders?
profit
trust...
asked 2 hours ago -
Write an assembly language 32 bit program that reads in lines of
text by a .txt...
asked 2 hours ago -
what is the density ( in g/L) of hydrogen gas at 29 degrees C and a...
asked 2 hours ago -
5-6. You are considering three investment alternatives for some
spare cash: Old Reliable Corporation stock (A1),...
asked 2 hours ago