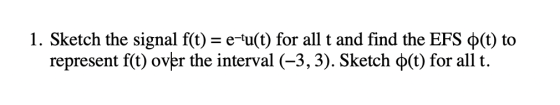
Sketch the signal f(t) = e^(-t)u(t) for all t and find the EFS phi(t) to represent f(t) over the interval (-3,3). Sketch phi(t) for all t.
Homework Answers

![49=[ 2:43+ 3mt) _ 1] = 0+32mm [e? cosnt - 2] en = 1-écos MT 6+ jent +n + 1-e 6+J2nIT e 3 Olt) = - n=-0 nolt) +0.05](http://img.homeworklib.com/questions/14572920-9a50-11eb-ad6b-ef72dc655a88.png?x-oss-process=image/resize,w_560)
Add Answer to:
Sketch the signal f(t) = e^(-t)u(t) for all t and find the EFS
phi(t) to represent...
solve it using matlab 2.7-1 (a) Sketch the signal g(t) = 12 and find the exponential...
 solve it using matlab
2.7-1 (a) Sketch the signal g(t) = 12 and find the exponential Fourier series to represent 8(1) over the interval (-1, 1). Sketch the Fourier series p(i) for all values of 1.
solve it using matlab
2.7-1 (a) Sketch the signal g(t) = 12 and find the exponential Fourier series to represent 8(1) over the interval (-1, 1). Sketch the Fourier series p(i) for all values of 1.
l, f) is a periodic signal with period f(t)-n(t)-u(t-t/2 ) for 0 2π a.) Find the exponential Fourier series of f() and sketchf). What is the fundamental radian frequency. b.) Evaluate and sketch...
 l, f) is a periodic signal with period f(t)-n(t)-u(t-t/2 ) for 0 2π a.) Find the exponential Fourier series of f() and sketchf). What is the fundamental radian frequency. b.) Evaluate and sketch |Dml, the magnitude of the Fourier series coefficients vs.o in the range of -4s n S4 c.) Evaluate and sketch the phase angle of D, vs. co in the same range (-4S n S4) d.) Find the signal average power e) Find the approximate average power of...
(a) Sketch the spectrum of the signal r(t). Show the spectrum as a function of f...
 (a) Sketch the spectrum of the signal r(t). Show the spectrum as a function of f in Hz For the rest of this problem, assume that the signal is sampled at a rate of fs 50 Hz. (b) Sketch the spectrum for the sampled signal rn). Your spectrum should be shown as a function of the normalized frequency over the interval-2π < -+2T. c) Write an equation for the sampled signal [n. (d) Suppose that the signal is reconstructed from...
4. (a) Consider a continuous-time signal given by j101 f(t)= e ' [u(t) - u(t –...
 4. (a) Consider a continuous-time signal given by j101 f(t)= e ' [u(t) - u(t – 2)] (i) Find the Fourier transform of f(t) using the properties listed in the Appendix on page 6. (ii) If the signal f(t) is sampled in the time domain, what is the Nyquist rate (in Hertz) of f(t)? Comment on your result. (8 Marks)
The following signal, f(t), is periodic. Over the interval t = [0,1], f(t) is proportional to...
 The following signal, f(t), is periodic. Over the interval t =
[0,1], f(t) is proportional to an exponential (f(t)~e^at (you need
to specify ‘a’ and the DC offset). Find the RMS value of the
following signal. Begin by writing an equation for f(t).
The following signal, f(t), is periodic. Over the interval t = [0,1],f(t) is proportional to an exponential(t)-e" (you need to specify a and the DC offset). Find the RMS value of the following signal. Begin by writing...
The following signal, f(t), is periodic. Over the interval t =
[0,1], f(t) is proportional to an exponential (f(t)~e^at (you need
to specify ‘a’ and the DC offset). Find the RMS value of the
following signal. Begin by writing an equation for f(t).
The following signal, f(t), is periodic. Over the interval t = [0,1],f(t) is proportional to an exponential(t)-e" (you need to specify a and the DC offset). Find the RMS value of the following signal. Begin by writing...
3. Assume the signal x(t) = 5.e-2 u(t) V. (a) Calculate the signal energy (on a...
 3. Assume the signal x(t) = 5.e-2 u(t) V. (a) Calculate the signal energy (on a 1-ohm basis) over the time interval from - to too. (b) Calculate the signal energy (on a 1-ohm basis) over the frequency range from - to too. (c) Repeat part (b) over the frequency range from -2 to +2 Hz. (d) Do your answers in parts (a), (b), and (c) make sense? Explain.
" 2.9.2 USC volalled in Example 2.5.1. Represent the signal f(t)*= 1 -1<t< 0 0<i<1 elsewhere...
 " 2.9.2 USC volalled in Example 2.5.1. Represent the signal f(t)*= 1 -1<t< 0 0<i<1 elsewhere over the interval (-2,2). a) Use the exponential Fourier series. b) Use the trigonometric Fourier series. c) Compare your results using Eqs. (2.49)-(2.51).
1. Signal f(t) : (5 + rect( )) cos(60πt) is mixed with signal cos(60πt) to produce the signal y(t...
 1. Signal f(t) : (5 + rect( )) cos(60πt) is mixed with signal cos(60πt) to produce the signal y(t). Subsequently, COS y(t) is low-pass filtered with a system having frequency response H(w) = 4recG ) to produce q(t). Sketch F(w),Y(w), Q(u), and determine q(t) 2. If signal f(t) is not band-limited, would it be possible to reconstruct f(t) exactly from its samples f(nT) taken with some finite sampling interval T> 0? Explain your reasoning
1. Signal f(t) : (5 +...
1. Signal f(t) : (5 + rect( )) cos(60πt) is mixed with signal cos(60πt) to produce the signal y(t). Subsequently, COS y(t) is low-pass filtered with a system having frequency response H(w) = 4recG ) to produce q(t). Sketch F(w),Y(w), Q(u), and determine q(t) 2. If signal f(t) is not band-limited, would it be possible to reconstruct f(t) exactly from its samples f(nT) taken with some finite sampling interval T> 0? Explain your reasoning
1. Signal f(t) : (5 +...
Problem 2: For the signal g(t) t, a) (25 points) Find the exponential Fourier series to...
 Problem 2: For the signal g(t) t, a) (25 points) Find the exponential Fourier series to represent g(t) over the interval (-π, π). Sketch the spectra (amplitude and phase of Fourier series coefficients). b) (25 points) Find the average power of g(t) within interval (- ,r). Using this result and given that Σ00.-6, verify the Parseval's theorem
Question # 4 Let x(t) u(t) be a signal, let h(t) = e -5tu(t) be a...
 Question # 4 Let x(t) u(t) be a signal, let h(t) = e -5tu(t) be a linear time invariant system (a) Sketch x(t) and h(t) (b) Find the mathematival expression of output of the system y(t) by using convolution. (c) Sketch y(t)
 solve it using matlab
2.7-1 (a) Sketch the signal g(t) = 12 and find the exponential Fourier series to represent 8(1) over the interval (-1, 1). Sketch the Fourier series p(i) for all values of 1.
solve it using matlab
2.7-1 (a) Sketch the signal g(t) = 12 and find the exponential Fourier series to represent 8(1) over the interval (-1, 1). Sketch the Fourier series p(i) for all values of 1.
 l, f) is a periodic signal with period f(t)-n(t)-u(t-t/2 ) for 0 2π a.) Find the exponential Fourier series of f() and sketchf). What is the fundamental radian frequency. b.) Evaluate and sketch |Dml, the magnitude of the Fourier series coefficients vs.o in the range of -4s n S4 c.) Evaluate and sketch the phase angle of D, vs. co in the same range (-4S n S4) d.) Find the signal average power e) Find the approximate average power of...
 (a) Sketch the spectrum of the signal r(t). Show the spectrum as a function of f in Hz For the rest of this problem, assume that the signal is sampled at a rate of fs 50 Hz. (b) Sketch the spectrum for the sampled signal rn). Your spectrum should be shown as a function of the normalized frequency over the interval-2π < -+2T. c) Write an equation for the sampled signal [n. (d) Suppose that the signal is reconstructed from...
 4. (a) Consider a continuous-time signal given by j101 f(t)= e ' [u(t) - u(t – 2)] (i) Find the Fourier transform of f(t) using the properties listed in the Appendix on page 6. (ii) If the signal f(t) is sampled in the time domain, what is the Nyquist rate (in Hertz) of f(t)? Comment on your result. (8 Marks)
 The following signal, f(t), is periodic. Over the interval t =
[0,1], f(t) is proportional to an exponential (f(t)~e^at (you need
to specify ‘a’ and the DC offset). Find the RMS value of the
following signal. Begin by writing an equation for f(t).
The following signal, f(t), is periodic. Over the interval t = [0,1],f(t) is proportional to an exponential(t)-e" (you need to specify a and the DC offset). Find the RMS value of the following signal. Begin by writing...
The following signal, f(t), is periodic. Over the interval t =
[0,1], f(t) is proportional to an exponential (f(t)~e^at (you need
to specify ‘a’ and the DC offset). Find the RMS value of the
following signal. Begin by writing an equation for f(t).
The following signal, f(t), is periodic. Over the interval t = [0,1],f(t) is proportional to an exponential(t)-e" (you need to specify a and the DC offset). Find the RMS value of the following signal. Begin by writing...
 3. Assume the signal x(t) = 5.e-2 u(t) V. (a) Calculate the signal energy (on a 1-ohm basis) over the time interval from - to too. (b) Calculate the signal energy (on a 1-ohm basis) over the frequency range from - to too. (c) Repeat part (b) over the frequency range from -2 to +2 Hz. (d) Do your answers in parts (a), (b), and (c) make sense? Explain.
 " 2.9.2 USC volalled in Example 2.5.1. Represent the signal f(t)*= 1 -1<t< 0 0<i<1 elsewhere over the interval (-2,2). a) Use the exponential Fourier series. b) Use the trigonometric Fourier series. c) Compare your results using Eqs. (2.49)-(2.51).
 1. Signal f(t) : (5 + rect( )) cos(60πt) is mixed with signal cos(60πt) to produce the signal y(t). Subsequently, COS y(t) is low-pass filtered with a system having frequency response H(w) = 4recG ) to produce q(t). Sketch F(w),Y(w), Q(u), and determine q(t) 2. If signal f(t) is not band-limited, would it be possible to reconstruct f(t) exactly from its samples f(nT) taken with some finite sampling interval T> 0? Explain your reasoning
1. Signal f(t) : (5 +...
1. Signal f(t) : (5 + rect( )) cos(60πt) is mixed with signal cos(60πt) to produce the signal y(t). Subsequently, COS y(t) is low-pass filtered with a system having frequency response H(w) = 4recG ) to produce q(t). Sketch F(w),Y(w), Q(u), and determine q(t) 2. If signal f(t) is not band-limited, would it be possible to reconstruct f(t) exactly from its samples f(nT) taken with some finite sampling interval T> 0? Explain your reasoning
1. Signal f(t) : (5 +...
 Problem 2: For the signal g(t) t, a) (25 points) Find the exponential Fourier series to represent g(t) over the interval (-π, π). Sketch the spectra (amplitude and phase of Fourier series coefficients). b) (25 points) Find the average power of g(t) within interval (- ,r). Using this result and given that Σ00.-6, verify the Parseval's theorem
 Question # 4 Let x(t) u(t) be a signal, let h(t) = e -5tu(t) be a linear time invariant system (a) Sketch x(t) and h(t) (b) Find the mathematival expression of output of the system y(t) by using convolution. (c) Sketch y(t)
Most questions answered within 3 hours.
-
What specific indicators can point to lack of progress for
African Americans in American society?
asked 38 minutes ago -
1-The Electrons in a beam are moving at 2.7×10⁸ m/s in an
electric field of 15000...
asked 54 minutes ago -
A gas tank is a vertical cylinder. It has a radius of 1m, a
height of...
asked 1 hour ago -
Accent Software faces the following conditions. All of these
support Accent’s use of a market-penetration pricing...
asked 2 hours ago -
A mathematically inclined friend emails you the following
instructions: "Meet me in the cafeteria the first...
asked 2 hours ago -
A monopoly sells in two countries . The demand curves in the two
countries are p1...
asked 3 hours ago -
A .15kg rubber ball is bounced off a wall. Before hitting the
wall, the ball moves...
asked 3 hours ago -
A manufacturing company preparing to build a new plant is
considering three potential locations for it....
asked 3 hours ago -
B. If compound Y has approximately the same values of solubility
in toluene as compound X,...
asked 4 hours ago -
Oscar Inc. has inventory in Japan valued at 39,051,000 Yen one
year ago. One year ago...
asked 4 hours ago -
If Canada suffered from "fundamental disequilibrium," and its
government choose not to devalue its currency, a...
asked 5 hours ago -
4. How many input & output Key Value Pairs are passed into,
and emitted out of...
asked 4 hours ago