
Homework Answers
a) The linear statistical model for this study can be expressed using the mathematical model that describes the relationship between the response and treatment for the one-way ANOVA is given by
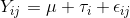
where
Yij represents the j-th observation (j=1,2,3,4) and on the i-th treatment (i = 1,2,3,4,5 levels) or are the number of heads of lettuce harvested from the plot.
mu is the common effect for the whole experiment
Tau_i represents the i-th treatment effect,
Eij represents the random error present in the j-th observation on the i-th treatment. They are assumed to be normally and independently distributed with mean zero and variance of sigma^2.
b) Assumptions for ANOVA
1. The experimental errors of your data are normally distributed
2. Equal variances between treatments: Homogeneity of variances Homoscedasticity
3. Independence of samples: Each sample is randomly selected and independent
c) Using Excel > DATA> one way ANOVA
| Anova: Single Factor | ||||||
| SUMMARY | ||||||
| Groups | Count | Sum | Average | Variance | ||
| Row 1 | 4 | 448 | 112 | 445.3333 | ||
| Row 2 | 4 | 582 | 145.5 | 395.6667 | ||
| Row 3 | 4 | 596 | 149 | 38.66667 | ||
| Row 4 | 4 | 630 | 157.5 | 51 | ||
| Row 5 | 4 | 596 | 149 | 182 | ||
| ANOVA | ||||||
| Source of Variation | SS | df | MS | F | P-value | F crit |
| Between Groups | 4994.8 | 4 | 1248.7 | 5.611294 | 0.005757 | 3.055568 |
| Within Groups | 3338 | 15 | 222.5333 | |||
| Total | 8332.8 | 19 |
Add Answer to:
AaBbccI AaBbcel AaBbC AaBbCct AaB AaBbccl AaBbCcL AaBbc l Normal T No Spaci... Heading 1 Heading2...
2. An experiment was conducted to test the effects of nitrogen fertilizer on lettuce production. Five...
2. An experiment was conducted to test the effects of nitrogen fertilizer on lettuce production. Five rates of ammonium nitrate were applied to four replicate plots in a completely randomized design. The data are the number of heads of lettuce harvested from the plot. Treatment (lb N/acre) Head of lecture/plot 0 104 114 90 140 50 134 130 144 174 100 146 142 152 156 150 147 160 160 163 200 131 148 154 163 Write the linear statistical model...
Most questions answered within 3 hours.
-
Given P(Ec ) = 0.43, P(F) = 0.52, and P(EF) = 0.18.
Find P( E |...
asked 29 minutes ago -
Consider two empty containers A and B whose volumes are
10mL and 20mL respectively. 1mL of...
asked 32 minutes ago -
QUESTION 6
Determine the linear momentum of a 2,800 kg houseboat going 3
m/s.
9,100 kg.m/s...
asked 46 minutes ago -
Jor-el throws a ball upward from the top of a 728 foot building
on the planet...
asked 50 minutes ago -
Which of the following will most likely to happen if Federal
Reserve Bank decreases the money...
asked 33 minutes ago -
You’ve just joined the investment banking firm of Dewey,
Cheatum, and Howe. They’ve offered you two...
asked 27 minutes ago -
An air conditioner cools 226 m^3/min of humid air at 36 oC and
98% relative humidity...
asked 26 minutes ago -
Vaughn Manufacturing acquires a coal mine at a cost of $1870000.
Intangible development costs total $354000....
asked 35 minutes ago -
Question 5
What effect would a decrease in
temperature have on pressure, assuming that volume
(T)...
asked 48 minutes ago -
Draw the Lewis dot structures for the following molecules. None
of the atoms have a formal...
asked 52 minutes ago -
What does it mean when an element is radioactive?
a.
It means the element is changing...
asked 53 minutes ago -
A company deposits $6,000 in a bank at the end of every year for
10 years....
asked 52 minutes ago