Complete PART (b) ONLY. Please use answer from Part (a). Please complete this using EXCEL; SHow the steps/ excel calculations.
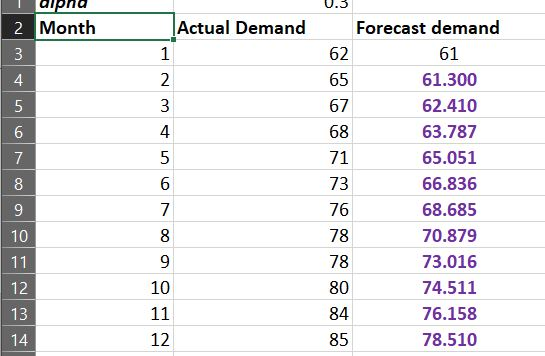
| Month | Actual Demand |
| 1 | 62 |
| 2 | 65 |
| 3 | 67 |
| 4 | 68 |
| 5 | 71 |
| 6 | 73 |
| 7 | 76 |
| 8 | 78 |
| 9 | 78 |
| 10 | 80 |
| 11 | 84 |
| 12 | 85 |
part (a)

MY answer to Part (a):
Part (b)
(b) Now calculate all the measures of forecasting accuracy listed below for the single exponential smoothing forecast completed in part (a)
-i) MAPE (Mean Absolute Percent Error)
- ii) MSE (Mean squared error)
- iii) MAD (Mean absolute Deviation)
PLEASE SHOW YOUR WORK USING EXCEL
FORMULAS:

Homework Answers
Answer
![month error absolute error 2 error] % error 1 65 3.70 4.59 actual forecast demand ES a=0.3 62 61.00 61.30 67 62.41 68 63.79 7](http://img.homeworklib.com/questions/c5fcfd30-9f13-11eb-b969-d19f95903cd5.png?x-oss-process=image/resize,w_560)
(Please like the answer it will encourage me.)
Add Answer to:
Complete PART (b) ONLY. Please use answer from Part
(a). Please complete this using EXCEL; SHow...
Answer all parts please :) A convenience store recently started to carry a new brand of...
 Answer all parts please :)
A convenience store recently started to carry a new brand of soft drink. Management is interested in estimating future sales volume to determine whether it should continue to carry the new brand or replace it with another brand. The following table provides the number of cans sold per week. Use both the trend projection with regression and the exponential smoothing (let α = 0.4 with an initial forecast for week 1 of 617 methods to...
Answer all parts please :)
A convenience store recently started to carry a new brand of soft drink. Management is interested in estimating future sales volume to determine whether it should continue to carry the new brand or replace it with another brand. The following table provides the number of cans sold per week. Use both the trend projection with regression and the exponential smoothing (let α = 0.4 with an initial forecast for week 1 of 617 methods to...
1.Please use the Hawkins sheet. What is the MFE , MAE , MSE , an...
 1.Please use the Hawkins sheet.
What is the MFE , MAE , MSE ,
and MAPE for a three-month moving average
forecast? Round to two decimal places.
2.Please use the Hawkins sheet.
What is the MFE , MAE , MSE ,
and MAPE for the exponential smoothing forecast with
alpha = 0.2? Round to two decimal places.
3.Please use the Hawkins sheet.
Based on the MSE values found in Questions 1 & 2, which
forecast is best?
------------------------------------------------------------------
Thank you...
1.Please use the Hawkins sheet.
What is the MFE , MAE , MSE ,
and MAPE for a three-month moving average
forecast? Round to two decimal places.
2.Please use the Hawkins sheet.
What is the MFE , MAE , MSE ,
and MAPE for the exponential smoothing forecast with
alpha = 0.2? Round to two decimal places.
3.Please use the Hawkins sheet.
Based on the MSE values found in Questions 1 & 2, which
forecast is best?
------------------------------------------------------------------
Thank you...
A manager has been using a certain technique to forecast demand for project management software at...
A manager has been using a certain technique to forecast demand for project management software at her store. Actual demand and her corresponding predictions are shown below: MonthActual Demand Manager's Forecast March4545April4250May3445June4840July3845 a. What was the manager's forecast error for each month?b. What is the mean error (ME), the mean squared error (MSE), the mean absolute deviation (MAD), and the tracking signal for these five months of forecasting?c. If the manager had used a 3-month moving average instead of her technique, what would have...
Day Demand Avg Jan 88 Fab 89.06666667 Mar 88.375 Apr 88.03225806 Ma...
Day Demand Avg Jan 88 Fab 89.06666667 Mar 88.375 Apr 88.03225806 May 86.53125 Jun 81.87096774 Jul 79 Aug 80.125 Sep 83.61290323 Oct 88.5 Nov 89.29032258 Dec 90.21052632 Estimate the January forecast using Seasonal forecast. 12-month moving average forecast. Exponential smoothing (for an alpha of your choosing) Calculate the Mean Forecast Error (MFE), Mean Absolute Deviation (MAD) and Mean Squared Error (MSE) and compare the results. Write a line or two explaining the superior model(s) for this particular data set including...
A convenience store recently started to carry a new brand of soft drink. Management is interested in estimating future...
 A convenience store recently started to carry a new brand of soft drink. Management is interested in estimating future sales volume to detemine whether it should continue another brand. The following table provides the number of cans sold per week. Use both the trend projection with regression and the exponential smoothing (let 0.4 with an initial forecast for week 1 of 577) methods to forecast demand for week 13. Compare these methods by using the mean absolute deviation and mean...
A&B Question 2 The table below shows the aggregate demand of pool cleaning equipment during the...
 A&B
Question 2 The table below shows the aggregate demand of pool cleaning equipment during the last 12 years for Watertech Company in Arizona YEAR> DEMAND 1,513 1,485 1,4911,4471,525 1,493 1,477 1,562 1,476 1,513 1,4 Please forecast the demand for 2017 using the following two methods 2005 2006 2007 2008 2009 2010 20112012 2013 2014 2015 2016 80 1,466 a. Simple Moving Average, SMA (5) b. Simple Exponential Smoothing (you define the value of 'a, that minimizes MSE error) Compare...
A&B
Question 2 The table below shows the aggregate demand of pool cleaning equipment during the last 12 years for Watertech Company in Arizona YEAR> DEMAND 1,513 1,485 1,4911,4471,525 1,493 1,477 1,562 1,476 1,513 1,4 Please forecast the demand for 2017 using the following two methods 2005 2006 2007 2008 2009 2010 20112012 2013 2014 2015 2016 80 1,466 a. Simple Moving Average, SMA (5) b. Simple Exponential Smoothing (you define the value of 'a, that minimizes MSE error) Compare...
PLEASE ONLY ANSWER IF YOU CAN DO WHAT IS BLANK, I DON'T NEED HELP WITH WHAT...
 PLEASE ONLY ANSWER IF YOU CAN DO WHAT IS BLANK, I DON'T NEED
HELP WITH WHAT IS FILLED OUT ALREADY. THANK YOU!
Problem 15-03 (Algorithmic) Consider the following time series data. Week 1 2 3 4 5 6 Value 1914 16 10 17 15 Using the naive method (most recent value) as the forecast for the next week, compute the following measures of forecast accuracy: a. Mean absolute error (MAE) b. Mean squared error (MSE) c. Mean absolute percentage error...
PLEASE ONLY ANSWER IF YOU CAN DO WHAT IS BLANK, I DON'T NEED
HELP WITH WHAT IS FILLED OUT ALREADY. THANK YOU!
Problem 15-03 (Algorithmic) Consider the following time series data. Week 1 2 3 4 5 6 Value 1914 16 10 17 15 Using the naive method (most recent value) as the forecast for the next week, compute the following measures of forecast accuracy: a. Mean absolute error (MAE) b. Mean squared error (MSE) c. Mean absolute percentage error...
The following table contains the demand from the last 10 months: MONTH ACTUAL DEMAND 1 34...
The following table contains the demand from the last 10 months: MONTH ACTUAL DEMAND 1 34 2 37 3 38 4 37 5 40 6 37 7 42 8 44 9 41 10 42 a. Calculate the single exponential smoothing forecast for these data using an ? of 0.20 and an initial forecast (F1) of 34. (Round your intermediate calculations and answers to 2 decimal places.) Month Exponential Smoothing 1 2 3 4 5 6 7 8 9 10 b....
The following table contains the demand from the last 10 months: MONTH ACTUAL DEMAND 1 33...
The following table contains the demand from the last 10 months: MONTH ACTUAL DEMAND 1 33 2 29 3 32 4 33 5 35 6 32 7 35 8 42 9 44 10 45 a. Calculate the single exponential smoothing forecast for these data using an α of 0.10 and an initial forecast (F1) of 33. (Round your answers to 2 decimal places.) b. Calculate the exponential smoothing with trend forecast for these data using an α of 0.10, a...
Two different forecasting techniques (F1 and F2) were used to forecast demand for cases of bottled...
 Two different forecasting techniques (F1 and F2) were used to forecast demand for cases of bottled water. Note: It doesn't matter what forecasting method was used. This problem is simply to practice with MAD and MAPE! Actual demand and the two sets of forecasts are as follows: Period PREDICTED DEMAND F2 67 60 Demand 68 F1 75 67 67 71 70 69 70 74 69 72 72 77 71 77 80 78 70 72 75 75 83 a. Compute MAD...
 Answer all parts please :)
A convenience store recently started to carry a new brand of soft drink. Management is interested in estimating future sales volume to determine whether it should continue to carry the new brand or replace it with another brand. The following table provides the number of cans sold per week. Use both the trend projection with regression and the exponential smoothing (let α = 0.4 with an initial forecast for week 1 of 617 methods to...
Answer all parts please :)
A convenience store recently started to carry a new brand of soft drink. Management is interested in estimating future sales volume to determine whether it should continue to carry the new brand or replace it with another brand. The following table provides the number of cans sold per week. Use both the trend projection with regression and the exponential smoothing (let α = 0.4 with an initial forecast for week 1 of 617 methods to...
 1.Please use the Hawkins sheet.
What is the MFE , MAE , MSE ,
and MAPE for a three-month moving average
forecast? Round to two decimal places.
2.Please use the Hawkins sheet.
What is the MFE , MAE , MSE ,
and MAPE for the exponential smoothing forecast with
alpha = 0.2? Round to two decimal places.
3.Please use the Hawkins sheet.
Based on the MSE values found in Questions 1 & 2, which
forecast is best?
------------------------------------------------------------------
Thank you...
1.Please use the Hawkins sheet.
What is the MFE , MAE , MSE ,
and MAPE for a three-month moving average
forecast? Round to two decimal places.
2.Please use the Hawkins sheet.
What is the MFE , MAE , MSE ,
and MAPE for the exponential smoothing forecast with
alpha = 0.2? Round to two decimal places.
3.Please use the Hawkins sheet.
Based on the MSE values found in Questions 1 & 2, which
forecast is best?
------------------------------------------------------------------
Thank you...
 A convenience store recently started to carry a new brand of soft drink. Management is interested in estimating future sales volume to detemine whether it should continue another brand. The following table provides the number of cans sold per week. Use both the trend projection with regression and the exponential smoothing (let 0.4 with an initial forecast for week 1 of 577) methods to forecast demand for week 13. Compare these methods by using the mean absolute deviation and mean...
 A&B
Question 2 The table below shows the aggregate demand of pool cleaning equipment during the last 12 years for Watertech Company in Arizona YEAR> DEMAND 1,513 1,485 1,4911,4471,525 1,493 1,477 1,562 1,476 1,513 1,4 Please forecast the demand for 2017 using the following two methods 2005 2006 2007 2008 2009 2010 20112012 2013 2014 2015 2016 80 1,466 a. Simple Moving Average, SMA (5) b. Simple Exponential Smoothing (you define the value of 'a, that minimizes MSE error) Compare...
A&B
Question 2 The table below shows the aggregate demand of pool cleaning equipment during the last 12 years for Watertech Company in Arizona YEAR> DEMAND 1,513 1,485 1,4911,4471,525 1,493 1,477 1,562 1,476 1,513 1,4 Please forecast the demand for 2017 using the following two methods 2005 2006 2007 2008 2009 2010 20112012 2013 2014 2015 2016 80 1,466 a. Simple Moving Average, SMA (5) b. Simple Exponential Smoothing (you define the value of 'a, that minimizes MSE error) Compare...
 PLEASE ONLY ANSWER IF YOU CAN DO WHAT IS BLANK, I DON'T NEED
HELP WITH WHAT IS FILLED OUT ALREADY. THANK YOU!
Problem 15-03 (Algorithmic) Consider the following time series data. Week 1 2 3 4 5 6 Value 1914 16 10 17 15 Using the naive method (most recent value) as the forecast for the next week, compute the following measures of forecast accuracy: a. Mean absolute error (MAE) b. Mean squared error (MSE) c. Mean absolute percentage error...
PLEASE ONLY ANSWER IF YOU CAN DO WHAT IS BLANK, I DON'T NEED
HELP WITH WHAT IS FILLED OUT ALREADY. THANK YOU!
Problem 15-03 (Algorithmic) Consider the following time series data. Week 1 2 3 4 5 6 Value 1914 16 10 17 15 Using the naive method (most recent value) as the forecast for the next week, compute the following measures of forecast accuracy: a. Mean absolute error (MAE) b. Mean squared error (MSE) c. Mean absolute percentage error...
 Two different forecasting techniques (F1 and F2) were used to forecast demand for cases of bottled water. Note: It doesn't matter what forecasting method was used. This problem is simply to practice with MAD and MAPE! Actual demand and the two sets of forecasts are as follows: Period PREDICTED DEMAND F2 67 60 Demand 68 F1 75 67 67 71 70 69 70 74 69 72 72 77 71 77 80 78 70 72 75 75 83 a. Compute MAD...
Most questions answered within 3 hours.
-
A manufacturer of chocolate chips would like to know whether its
bag filling machine works correctly...
asked 23 seconds ago -
when released from rest at point A, an unknown ion moves to
point B. At point...
asked 48 seconds from now -
A stock is expected to pay the following dividends: $1.1
four years from now, $1.4 five...
asked 4 minutes ago -
Consider the student registration business process at
your college:
1.)Describe the steps necessary for you to...
asked 7 minutes ago -
G=yellow and g=green pea seeds. You cross a heterozygous
yellow-seeded plant with a green-seeded plant to...
asked 7 minutes ago -
Current Balance Experiment
a) When there is no current flowing through the electromagnet
coil, is there...
asked 6 minutes ago -
In Visual Basic 2017, Write a complete Main method that prints
Hello, world to the screen....
asked 22 minutes ago -
a) Find the pressure difference on an airplane wing if air flows
over the upper surface...
asked 28 minutes ago -
Write an assessment of the current business analysis of Hilton
Worldwide using Porters 5 Forces analysis.
asked 39 minutes ago -
i need help on this
Chapter 9 Section 3 Question 1:
Rudy puts this poster, with...
asked 47 minutes ago -
True or false Assembly x86
41. _____ The program counter is a pointer to the
instruction....
asked 48 minutes ago -
You have conducted an experiment to try to demonstrate that
growth factor receptor X protein (GFRX)...
asked 1 hour ago