Im asking this again because the last answer was not helpful.
Homework Answers

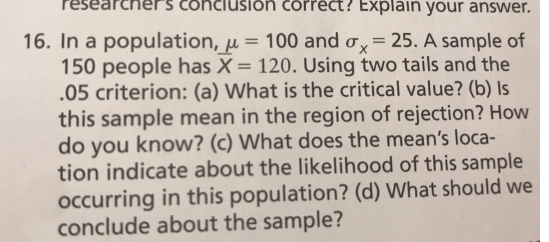
d) From this Confidence interval and Z value we conclude that the sample does not provide sufficient evidence to accept the claim the the true population mean is 100.
Add Answer to:
Im asking this again because the last answer was not
helpful.
researcher's conciusion correct? Explain your...
Individuals filing federal income tax returns prior to March 31 received an average refund of $1,066....
Individuals filing federal income tax returns prior to March 31 received an average refund of $1,066. Consider the population of "last-minute" filers who mail their tax return during the last five days of the income tax period (typically April 10 to April 15). a. A researcher suggests that a reason individuals wait until the last five days is that on average these individuals receive lower refunds than do early filers. Develop appropriate hypotheses such that rejection of H0 will support...
Please provide the correct answers for the ones marked with a RED X near them Individuals...
 Please provide the correct answers for the ones marked with a
RED X near them
Individuals filing federal income tax returns prior to March 31 received an average refund of $1,072. Consider the population of "last-minute" filers who mail their tax return during the last five days of the income tax period (typically April 10 to April 15) a. A researcher suggests that a reason individuals wait until the last five days is that on average these individuals receive lower...
Please provide the correct answers for the ones marked with a
RED X near them
Individuals filing federal income tax returns prior to March 31 received an average refund of $1,072. Consider the population of "last-minute" filers who mail their tax return during the last five days of the income tax period (typically April 10 to April 15) a. A researcher suggests that a reason individuals wait until the last five days is that on average these individuals receive lower...
The first picture contains the whole math problem. I went ahead and took additional pictures of...
 The first picture contains the whole math problem. I went
ahead and took additional pictures of each problem I need answers
for marked by a red X. For d, there’s a drop down for one of the
part so please choose the correct answer. THANKS IN
ADVANCE!!!
Individuals fling federal income tax returns prior to March 31 received an average refund of $1,079. Consider the population of "last-minute" filers who mail their tax return during the last five days of...
The first picture contains the whole math problem. I went
ahead and took additional pictures of each problem I need answers
for marked by a red X. For d, there’s a drop down for one of the
part so please choose the correct answer. THANKS IN
ADVANCE!!!
Individuals fling federal income tax returns prior to March 31 received an average refund of $1,079. Consider the population of "last-minute" filers who mail their tax return during the last five days of...
Section 5: One (OK, two) last question(s) 18. Before you answer this question, please re-read the...
 please answer this question
subject about Business Statistics thanks.
Section 5: One (OK, two) last question(s) 18. Before you answer this question, please re-read the explanation of objective 1 in the accompanying document, Introduction to Hypothesis Testing" and the first 2 pages of chapter 10. We are testing the hypothesis that the average family income in Anne Arundel County is more than $50,000. We take a random sample of 100 families (using good sampling technique so that the sample is...
please answer this question
subject about Business Statistics thanks.
Section 5: One (OK, two) last question(s) 18. Before you answer this question, please re-read the explanation of objective 1 in the accompanying document, Introduction to Hypothesis Testing" and the first 2 pages of chapter 10. We are testing the hypothesis that the average family income in Anne Arundel County is more than $50,000. We take a random sample of 100 families (using good sampling technique so that the sample is...
1. Answer to following with "True" or "False". Explain your answers briefly. (if false, explain what...
 1. Answer to following with "True" or "False". Explain your answers briefly. (if false, explain what happen instead also) (a) Suppose that we observe a random variable Y that depend on another observed value x, through the relationYo+By+ewhere Bo,ßı and x are (b) We can reduce a by pushing the critical regions further into the tails of the (c) Decrease in the probability of the type II error always results in an increase in constants ande N(0,1). Then Y N(O,(Po+Bix)-)...
eCoach Step 3: Mean 4 LabAssignment#3 Z-tests and T-tests Note: Be sure to read and answer...
 eCoach Step 3: Mean 4 LabAssignment#3 Z-tests and T-tests Note: Be sure to read and answer each question carefully, label and highlight your answers with the correct number/letter, and show all your work. FOLLOW THE TEMPLATE 1) Below are depression scores for women who report experiencing intimate partner violence. These scores were taken from a random sample of 10 women. In the general population, depression scores are normally distributed with a mean (μ) of 21 and a standard deviation (o)...
24. If the population mean is 0 and the population variance o, 1 (10 points) What...
 24. If the population mean is 0 and the population variance o, 1 (10 points) What is the P (z> 3) a. What is the P (z<2) b. What is the P (-1.5<z <3)? c. What is the P (-2.33cz < 1.25)? d. e. What is the P (-2.33<z and >1.25)? 25. If the population mean is 115 and the population variance σ, 100 (10 points) What is the P (z > 120) a. b. What is the P (2<150)?...
Please m asking for assistance on statistics Q10. A population consists of the following N-5 scores:...
 Please m asking for assistance on statistics
Q10. A population consists of the following N-5 scores: 0, 6, 4, 3, and 12 a. Compute u ando for the population b. Find the 2-score for each score in the population c. Transform the original population into a new population of N = 5 scores with a mean of u = 100 and a standard deviation of a = 20 Q11. For a sample with a mean of M = 51, a...
Please m asking for assistance on statistics
Q10. A population consists of the following N-5 scores: 0, 6, 4, 3, and 12 a. Compute u ando for the population b. Find the 2-score for each score in the population c. Transform the original population into a new population of N = 5 scores with a mean of u = 100 and a standard deviation of a = 20 Q11. For a sample with a mean of M = 51, a...
A survey was conducted two years ago asking college students their top motivations for using a...
A survey was conducted two years ago asking college students their top motivations for using a credit card. The percentages are shown in the table to the right. Also shown in the table is the observed frequency for these motivations from a current random sample of college students who use a credit card. Complete parts a through c below. Response Old Survey % New Survey Frequency, f Rewards 2727% 112112 Low rates 2323% 9797 Cash back 2222% 109109 Discounts...
2. Hypothesis tests about a population mean, population standard deviation known Aa Aa Lenders tighten or...
 2. Hypothesis tests about a population mean, population standard deviation known Aa Aa Lenders tighten or loosen their standards for issuing credit as economic conditions change. One of the criteria lenders use to evaluate the creditworthiness of a potential borrower is her credit risk score, usually a FICO score. FICO scores range from 300 to 850. A consumer with a high FICO score is perceived to be a low credit risk to the lender and is more likely to be...
 Please provide the correct answers for the ones marked with a
RED X near them
Individuals filing federal income tax returns prior to March 31 received an average refund of $1,072. Consider the population of "last-minute" filers who mail their tax return during the last five days of the income tax period (typically April 10 to April 15) a. A researcher suggests that a reason individuals wait until the last five days is that on average these individuals receive lower...
Please provide the correct answers for the ones marked with a
RED X near them
Individuals filing federal income tax returns prior to March 31 received an average refund of $1,072. Consider the population of "last-minute" filers who mail their tax return during the last five days of the income tax period (typically April 10 to April 15) a. A researcher suggests that a reason individuals wait until the last five days is that on average these individuals receive lower...
 The first picture contains the whole math problem. I went
ahead and took additional pictures of each problem I need answers
for marked by a red X. For d, there’s a drop down for one of the
part so please choose the correct answer. THANKS IN
ADVANCE!!!
Individuals fling federal income tax returns prior to March 31 received an average refund of $1,079. Consider the population of "last-minute" filers who mail their tax return during the last five days of...
The first picture contains the whole math problem. I went
ahead and took additional pictures of each problem I need answers
for marked by a red X. For d, there’s a drop down for one of the
part so please choose the correct answer. THANKS IN
ADVANCE!!!
Individuals fling federal income tax returns prior to March 31 received an average refund of $1,079. Consider the population of "last-minute" filers who mail their tax return during the last five days of...
 please answer this question
subject about Business Statistics thanks.
Section 5: One (OK, two) last question(s) 18. Before you answer this question, please re-read the explanation of objective 1 in the accompanying document, Introduction to Hypothesis Testing" and the first 2 pages of chapter 10. We are testing the hypothesis that the average family income in Anne Arundel County is more than $50,000. We take a random sample of 100 families (using good sampling technique so that the sample is...
please answer this question
subject about Business Statistics thanks.
Section 5: One (OK, two) last question(s) 18. Before you answer this question, please re-read the explanation of objective 1 in the accompanying document, Introduction to Hypothesis Testing" and the first 2 pages of chapter 10. We are testing the hypothesis that the average family income in Anne Arundel County is more than $50,000. We take a random sample of 100 families (using good sampling technique so that the sample is...
 1. Answer to following with "True" or "False". Explain your answers briefly. (if false, explain what happen instead also) (a) Suppose that we observe a random variable Y that depend on another observed value x, through the relationYo+By+ewhere Bo,ßı and x are (b) We can reduce a by pushing the critical regions further into the tails of the (c) Decrease in the probability of the type II error always results in an increase in constants ande N(0,1). Then Y N(O,(Po+Bix)-)...
 eCoach Step 3: Mean 4 LabAssignment#3 Z-tests and T-tests Note: Be sure to read and answer each question carefully, label and highlight your answers with the correct number/letter, and show all your work. FOLLOW THE TEMPLATE 1) Below are depression scores for women who report experiencing intimate partner violence. These scores were taken from a random sample of 10 women. In the general population, depression scores are normally distributed with a mean (μ) of 21 and a standard deviation (o)...
 24. If the population mean is 0 and the population variance o, 1 (10 points) What is the P (z> 3) a. What is the P (z<2) b. What is the P (-1.5<z <3)? c. What is the P (-2.33cz < 1.25)? d. e. What is the P (-2.33<z and >1.25)? 25. If the population mean is 115 and the population variance σ, 100 (10 points) What is the P (z > 120) a. b. What is the P (2<150)?...
 Please m asking for assistance on statistics
Q10. A population consists of the following N-5 scores: 0, 6, 4, 3, and 12 a. Compute u ando for the population b. Find the 2-score for each score in the population c. Transform the original population into a new population of N = 5 scores with a mean of u = 100 and a standard deviation of a = 20 Q11. For a sample with a mean of M = 51, a...
Please m asking for assistance on statistics
Q10. A population consists of the following N-5 scores: 0, 6, 4, 3, and 12 a. Compute u ando for the population b. Find the 2-score for each score in the population c. Transform the original population into a new population of N = 5 scores with a mean of u = 100 and a standard deviation of a = 20 Q11. For a sample with a mean of M = 51, a...
 2. Hypothesis tests about a population mean, population standard deviation known Aa Aa Lenders tighten or loosen their standards for issuing credit as economic conditions change. One of the criteria lenders use to evaluate the creditworthiness of a potential borrower is her credit risk score, usually a FICO score. FICO scores range from 300 to 850. A consumer with a high FICO score is perceived to be a low credit risk to the lender and is more likely to be...
Most questions answered within 3 hours.
-
Your friend tells you that there is a vending machine on campus
that dispenses M&M packs...
asked 4 minutes ago -
What advantages are there to using piperidine rather than
hydroxide as a base?
asked 2 minutes ago -
7. The life of a Freeze Breeze electric fan is normally
distributed with a mean 4...
asked 5 minutes ago -
1. A 751 mL NaCl solution is diluted to a volume of 1.06 L and a...
asked 10 minutes ago -
8
A $20,000 face value STRIPS is currently quoted at 38.642 and
has 8 years to...
asked 11 minutes ago -
The current exchange rate between the Japanese yen and
the US dollar is 120 yen per...
asked 13 minutes ago -
Marla’s Massages and More bought a special massage table two
years ago for $9,300. At the...
asked 20 minutes ago -
Suppose you require a peak output voltage of 15.0 V and have
available an AC source...
asked 20 minutes ago -
We
conduct A study to estimate the mean age of the population of women
at the...
asked 31 minutes ago -
.13 : Assume that we make an enhancement to a computer that
improves some mode of...
asked 33 minutes ago -
4)
Find the tension in an elevator cable if the 1000 kg elevator is
descending with...
asked 39 minutes ago -
A random sample of 51 newborn babies was taken at the Hospital.
The sample mean was...
asked 37 minutes ago