
Homework Answers
Add Answer to:
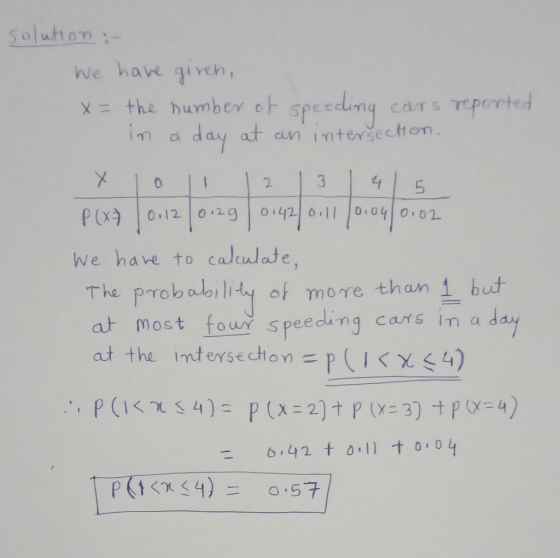
The following table contains the probability distribution for X = the number of speeding cars reported...
The probability distribution of x is represented by the following table x 1 2 3 4...
The probability distribution of x is represented by the following table x 1 2 3 4 5 6 p(x) 0.04 ?? 0.20 0.41 0.13 0.12 a. What is the value of p(x)=2: b. What is the value of p(3 ≤ x ≤ 6): c. If this table represents the number of falls your patients have sustained in the past year, what is the probability that your patient has fallen 5 times? d. If this table represents the number of falls...
the following table presents the probability distribution of the number of vacations X taken last year...
 the following table presents the probability distribution of
the number of vacations X taken last year for a randomly chosen
family.
Question 6 0.1 pts The following table presents the probability distribution of the number of vacations X taken last year for a randomly chosen family. Find P(1 or more). x 0 P(x) 0.15 1 0.56 2 0.15 3 4 0.1 0.04 0.29 0.56 0.71 0.85
the following table presents the probability distribution of
the number of vacations X taken last year for a randomly chosen
family.
Question 6 0.1 pts The following table presents the probability distribution of the number of vacations X taken last year for a randomly chosen family. Find P(1 or more). x 0 P(x) 0.15 1 0.56 2 0.15 3 4 0.1 0.04 0.29 0.56 0.71 0.85
Probability The following table contains the probability distribution for X = the number of occupants in...
Probability The following table contains the probability distribution for X = the number of occupants in a randomly chosen car on University Ave on a Monday morning. X 1 2 3 4 5 P(X) 0.32 0.26 0.33 0.04 0.05 Calculate the mean or expected value for the number of occupants in a car on University Ave on Monday morning? Show your working or attach an image of your handwritten solution (write your name at the top of your paper)
The following table contains the probability distribution for the number of traffic accidents daily in a...
 The following table contains the probability distribution for the number of traffic accidents daily in a smal town. Complete parts (a) and (b) to the right. a. Compute the mean number of accidents per day. Number of Accidents Px) (Type an integer or a decimal.) Daily (X) 0.22 0.25 0.21 0.11 0.09 0.07 0.05 b. Compute the standard deviation. (Type an integer or decimal rounded to three decimal places as needed.)
The joint probability distribution of the number X of cars and the number Y of buses...
The joint probability distribution of the number X of cars and the number Y of buses per signal cycle at a proposed left-turn lane is displayed in the accompanying joint probability table. y p(x, y) 0 1 2 x 0 0.025 0.010 0.015 1 0.050 0.020 0.030 2 0.125 0.050 0.075 3 0.150 0.060 0.090 4 0.100 0.040 0.060 5 0.050 0.020 0.030 (a) What is the probability that there is exactly one car and exactly one bus during...
Please do this in Excel if possible Problem 2. The following table contains the probability distribution...
 Please do this in Excel if possible
Problem 2. The following table contains the probability distribution for Xthe number of traffic accidents reported in a day in a small city in the Midwest: 0 1 23 5 P(X- 20 20 35 15 05 05 ) What is the probability of at least 1 accident? b) What ilwr: SUMPRODUCTO fanction in Excel may be helpful.) c) What is the variance of the number of accidents? d) What is the standard deviation...
Please do this in Excel if possible
Problem 2. The following table contains the probability distribution for Xthe number of traffic accidents reported in a day in a small city in the Midwest: 0 1 23 5 P(X- 20 20 35 15 05 05 ) What is the probability of at least 1 accident? b) What ilwr: SUMPRODUCTO fanction in Excel may be helpful.) c) What is the variance of the number of accidents? d) What is the standard deviation...
. Then use the sampling Consider the population described by the probability distribution shown in the...
 . Then use the sampling Consider the population described by the probability distribution shown in the table. The random variable x is observed twice. Find E(X) distribution of x to find the expected value of x BI! Click the icon to view the table. i More Info Find E(X) Etx) (Round to the nearest tenth as needed.) Find the expected value of using the sampling distribution of E(X)- (Round to the nearest tenth as needed.) 0.2 2.5 0.12 3 0.19...
Discrete probability problems 0.2 pts Question 12 The table below is a discrete probability distribution in...
 Discrete probability problems
0.2 pts Question 12 The table below is a discrete probability distribution in which x represents the number of tudents that a statistics tutor may see on any given day and Pix) represents the probability that the tutor sees that number of students. P(x) О.11 0.18 e.36 e.16 e.14 e.es What is the mean of this discrete probability distribution? (Round to the nearest hundredth.) Question 13 0.2 pts The table below is a discrete probability distribution in...
Discrete probability problems
0.2 pts Question 12 The table below is a discrete probability distribution in which x represents the number of tudents that a statistics tutor may see on any given day and Pix) represents the probability that the tutor sees that number of students. P(x) О.11 0.18 e.36 e.16 e.14 e.es What is the mean of this discrete probability distribution? (Round to the nearest hundredth.) Question 13 0.2 pts The table below is a discrete probability distribution in...
A used-car dealer gets complaints about his cars as shown in the table. Number of complaints...
 A used-car dealer gets complaints about his cars as shown in the table. Number of complaints per day 0 1 2 3 4 5 6 Probability 0.02 0.07 0.19 0.26 0.26 0.11 0.09 Find the expected number of complaints per day. The expected number of complaints per day is (Type an integer or a decimal. Do not round your answer.)
 the following table presents the probability distribution of
the number of vacations X taken last year for a randomly chosen
family.
Question 6 0.1 pts The following table presents the probability distribution of the number of vacations X taken last year for a randomly chosen family. Find P(1 or more). x 0 P(x) 0.15 1 0.56 2 0.15 3 4 0.1 0.04 0.29 0.56 0.71 0.85
the following table presents the probability distribution of
the number of vacations X taken last year for a randomly chosen
family.
Question 6 0.1 pts The following table presents the probability distribution of the number of vacations X taken last year for a randomly chosen family. Find P(1 or more). x 0 P(x) 0.15 1 0.56 2 0.15 3 4 0.1 0.04 0.29 0.56 0.71 0.85
 The following table contains the probability distribution for the number of traffic accidents daily in a smal town. Complete parts (a) and (b) to the right. a. Compute the mean number of accidents per day. Number of Accidents Px) (Type an integer or a decimal.) Daily (X) 0.22 0.25 0.21 0.11 0.09 0.07 0.05 b. Compute the standard deviation. (Type an integer or decimal rounded to three decimal places as needed.)
 Please do this in Excel if possible
Problem 2. The following table contains the probability distribution for Xthe number of traffic accidents reported in a day in a small city in the Midwest: 0 1 23 5 P(X- 20 20 35 15 05 05 ) What is the probability of at least 1 accident? b) What ilwr: SUMPRODUCTO fanction in Excel may be helpful.) c) What is the variance of the number of accidents? d) What is the standard deviation...
Please do this in Excel if possible
Problem 2. The following table contains the probability distribution for Xthe number of traffic accidents reported in a day in a small city in the Midwest: 0 1 23 5 P(X- 20 20 35 15 05 05 ) What is the probability of at least 1 accident? b) What ilwr: SUMPRODUCTO fanction in Excel may be helpful.) c) What is the variance of the number of accidents? d) What is the standard deviation...
 . Then use the sampling Consider the population described by the probability distribution shown in the table. The random variable x is observed twice. Find E(X) distribution of x to find the expected value of x BI! Click the icon to view the table. i More Info Find E(X) Etx) (Round to the nearest tenth as needed.) Find the expected value of using the sampling distribution of E(X)- (Round to the nearest tenth as needed.) 0.2 2.5 0.12 3 0.19...
 . Then use the sampling Consider the population described by the probability distribution shown in the table. The random variable x is observed twice. Find E(X) distribution of x to find the expected value of x BI! Click the icon to view the table. i More Info Find E(X) Etx) (Round to the nearest tenth as needed.) Find the expected value of using the sampling distribution of E(X)- (Round to the nearest tenth as needed.) 0.2 2.5 0.12 3 0.19...
 Discrete probability problems
0.2 pts Question 12 The table below is a discrete probability distribution in which x represents the number of tudents that a statistics tutor may see on any given day and Pix) represents the probability that the tutor sees that number of students. P(x) О.11 0.18 e.36 e.16 e.14 e.es What is the mean of this discrete probability distribution? (Round to the nearest hundredth.) Question 13 0.2 pts The table below is a discrete probability distribution in...
Discrete probability problems
0.2 pts Question 12 The table below is a discrete probability distribution in which x represents the number of tudents that a statistics tutor may see on any given day and Pix) represents the probability that the tutor sees that number of students. P(x) О.11 0.18 e.36 e.16 e.14 e.es What is the mean of this discrete probability distribution? (Round to the nearest hundredth.) Question 13 0.2 pts The table below is a discrete probability distribution in...
 A used-car dealer gets complaints about his cars as shown in the table. Number of complaints per day 0 1 2 3 4 5 6 Probability 0.02 0.07 0.19 0.26 0.26 0.11 0.09 Find the expected number of complaints per day. The expected number of complaints per day is (Type an integer or a decimal. Do not round your answer.)
Most questions answered within 3 hours.
-
Preparation of Benzoic Acid using a Grignard Reagent URGENT
1. During your Grignard formation, a small...
asked 19 minutes ago -
A uniform magnetic field is perpendicular to the plane of a wire
loop. If the loop...
asked 17 minutes ago -
At the peak of your career, your were earning $120,000 and
holding a top level position....
asked 21 minutes ago -
. A permanent magnet is dropped south-end-down through a horizontal
circular coil with a radius of...
asked 23 minutes ago -
Bernie's Beverages purchased some fixed assets classified as
5-year property for MACRS. The assets cost $28,000....
asked 37 minutes ago -
How many ATPs are produced from the catabolism of a 10-C
molecule of fatty acid under...
asked 41 minutes ago -
Before practicing a routine on the rings, a 64.8 kg gymnast
hangs motionless, with one hand...
asked 43 minutes ago -
If the K b of a weak base is 6.3 × 10 − 6 , what...
asked 49 minutes ago -
Which of the following is the minimum amount of moles of NaOH
that must be added...
asked 53 minutes ago -
Stories about organizational ________ provide important clues
about cultural values and norms.
a. myths
b. heroes...
asked 55 minutes ago -
Explain the criteria used in selecting a target market
BUS220 Retail Management, thank you!
asked 57 minutes ago -
Convert/Calculate the following:
Determine the identity of an elemental gas if 4.55 L weighing
35.4g, under...
asked 1 hour ago