One of the biggest factors in determining the value of a home is the square footage....
One of the biggest factors in determining the value of a home is the square footage. The accompanying data represent the square footage and selling price (in thousands of dollars) for a random sample of homes for sale in a certain region. Complete parts (a) through (h) below.
Square Footage Selling Price ($000s), y
2095 362.9
3122 364.9
1085 183.2
1935 331.9
3149 626.8
2772 370.3
3963 604.3
2170 370.5
2710 440.8
1695 296
1763 267.5
3723 675.7
(a) Which variable is the explanatory variable? choose one
o Square Footage
0 Selling Price
(b) Draw a scatter diagram of the data. Choose the correct scatter diagram below.
(c) Determine the linear correlation coefficient between square footage and asking price.
r= ___
(e) Find the least-squares regression line treating square footage as the explanatory variable.
(f) Interpret the slope. Select the correct choice below and, if necessary, fill in the answer box to complete your choice.
A.For a house that is sold for $0, the predicted square footage is ___
(Round to two decimal places as needed.)
B.For every additional square foot, the selling price increases by ___thousand dollars, on average.
(Round to two decimal places as needed.)
C.For a house that is 0 square feet, the predicted selling price is ___ thousand dollars.
(Round to two decimal places as needed.)
D.For every additional thousand dollars in selling price, the square footage increases by __ square feet, on average.
(Round to two decimal places as needed.)
E. It is not appropriate to interpret the slope.
(g) Is it reasonable to interpret the y-intercept? Why? Select the correct choice below and, if necessary, fill in the answer box to complete your choice.
(h) One home that is 1493 square feet is sold for $225 thousand. Is this home's price above or below average for a home of this size?
Homework Answers
a) Explanatory variable is the independent variable . Here square footage is the explanatory variable.
b) The scatter plot is as shown below. Ignore the trend line in the plot.
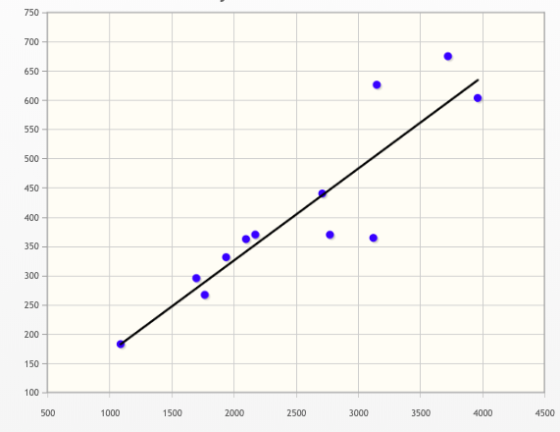
c)The linear correlation coefficient r=0.9002 d) The linear regression line
is y= 12.51+0.157x
d) The linear regression line
is y= 12.51+0.157x
where y is the selling price and x is the square footage.

f) For every additional square foot, the selling price increases by 0.157 thousand dollars, on average.
option B is correct.
g) It is not reasonable to interpret the y intercept. Because y-intercept is the selling price of the home whose square foot is 0 which is not possible in real life.
h)for x=1493 the predicted y value is y= 12.51+(0.157*1493) = $246.911 thousand
given home that is 1493 square feet is sold for $225 thousand which is below the average for a home of this size.
For any query please comment below.
Add Answer to:
One of the biggest factors in determining the value of a home is
the square footage....
One of the biggest factors in determining the value of a home is the square footage....
One of the biggest factors in determining the value of a home is the square footage. The accompanying data represent the square footage and selling price (in thousands ofdollars) for a random sample of homes for sale in a certain region. Complete all parts below (A.) Which variable is the explanatory variable? a. selling price b. square footage Square Footage, x Selling Price ($000s), y 2221 382.7 3046 353.4 1175 197.2 1938 332.2 3166 630.2 2857 383.9 4086 623.6...
One of the biggest factors in determining the value of a home is the square footage....
 One of the biggest factors in determining the value of a home is the square footage. The accompanying data represent the square footage and selling price on thousands of dollars) for a random sample of homes for sale in a certain region Complete parts (a) through) below Click the icon to view the housing data Data Table (1) Draw a scatter diagram of the data Choose the correct scatter OA 700 AY 000 Selling Price 15000). 3744 3516 1865 3224...
One of the biggest factors in determining the value of a home is the square footage....
 One of the biggest factors in determining the value of a home is the square footage. The accompanying data represent the square footage and selling price in thousands of dollars) for a random sample of homes for sale in a certain region. Complete parts (a) through (h) below. square feet, on average. Click the icon to view the housing data. D. For every additional thousand dollars in selling price, the square footage increases by (Round to three decimal places as...
This Question: 1 pt 10 of 15 (12 complete) A Data Table One of the biggest...
 This Question: 1 pt 10 of 15 (12 complete) A Data Table One of the biggest factors in determining the value of a home dollars) for a random sample of homes for sale. Complete part Es: Click the icon to view the data table. = Click the icon to view a table of critical values for the corre (a) Which variable is the explanatory variable? O A. Determining the value of a home OB Number of homes OC. Asking price...
(is/is not) (more/less) Square_Feet Price_($000) 1,166 262 3,079 608 1,565 281 1,066 223 2,067 328 2,386...
 (is/is not) (more/less)
Square_Feet Price_($000)
1,166 262
3,079 608
1,565 281
1,066 223
2,067 328
2,386 361
905 187
2,929 431
1,365 284
2,908 565
2,944 412
1,309 289
1,828 305
1,629 313
1,884 324
2,267 438
1,134 233
2,593 509
1,115 258
1,749 325
The accompanying data table contains the listed prices (in thousands of dollars) and the number of square feet for 20 homes listed by a realtor in a certain city. Complete parts a through f below....
(is/is not) (more/less)
Square_Feet Price_($000)
1,166 262
3,079 608
1,565 281
1,066 223
2,067 328
2,386 361
905 187
2,929 431
1,365 284
2,908 565
2,944 412
1,309 289
1,828 305
1,629 313
1,884 324
2,267 438
1,134 233
2,593 509
1,115 258
1,749 325
The accompanying data table contains the listed prices (in thousands of dollars) and the number of square feet for 20 homes listed by a realtor in a certain city. Complete parts a through f below....
House price y is estimated as a function of the square footage of a house x...
House price y is estimated as a function of the square footage of a house x and a dummy variable d that equals 1 if the house has ocean views. The estimated house price, measured in $1,000s, is given by yˆy^ = 118.90 + 0.12x + 52.60d. a-1. Compute the predicted price (in $1,000s) of a house with ocean views and square footage of 2,000. (Round intermediate calculations to at least 4 decimal places. Round your answer to 2 decimal...
Suppose that in a certain neighborhood, the cost of a home (in thousands) is proportional to...
Suppose that in a certain neighborhood, the cost of a home (in thousands) is proportional to the size of the home in square feet. The regression equation quantifying this relationship is found to be (price) = 0.048*(size) + 39.137. You look more closely at one of the houses selected. The house is listed as having 1383.117 square feet and is listed at a price of $107.544 (thousand). The residual is 2.017. Interpret this residual in terms of the problem. Question...
Tests A division of a multinational retail company prepared a presentation to give at the home...
 Tests A division of a multinational retail company prepared a presentation to give at the home office in Paris, France. The presentation includes a scatterplot that shows the relationship between square footage and annual sales in retail outlets owned by the chain. The units in the plot show the size in thousands of square feet and the response in thousands of dollars. A fitted line in the plot is y = 48 +683x. Complete parts a through d below. (a)...
Question 5 10 pts The table below shows the rental price of homes on the coast...
 Question 5 10 pts The table below shows the rental price of homes on the coast of New Jersey and their square footage. There are 14 observations. Copy the data into Excel and be sure to use all observations in your analysis. Rental Price Square Feet ($) 875 1400 900 2000 900 1300 1090 1600 1175 1800 1250 2800 1400 1400 2200 1500 1600 1700 1700 1800 2600 1900 2400 2000 2600 1900 1600 2000 Use simple regression analysis to...
options C and D for the mutiple choice questions are C: The selling price of this...
 options C and D for the mutiple choice questions are
C: The selling price of this particular house is less than the
predicted value by the amount of the residual.
D: The residual is the predicted selling orice for house with
zero square feet.
For the response variable y, the selling price in thousands of dollars, and the expanatory variable x, the size of the house in thousands of square feet. ý = 9.5 +77 2x. a. How much do...
options C and D for the mutiple choice questions are
C: The selling price of this particular house is less than the
predicted value by the amount of the residual.
D: The residual is the predicted selling orice for house with
zero square feet.
For the response variable y, the selling price in thousands of dollars, and the expanatory variable x, the size of the house in thousands of square feet. ý = 9.5 +77 2x. a. How much do...
 One of the biggest factors in determining the value of a home is the square footage. The accompanying data represent the square footage and selling price on thousands of dollars) for a random sample of homes for sale in a certain region Complete parts (a) through) below Click the icon to view the housing data Data Table (1) Draw a scatter diagram of the data Choose the correct scatter OA 700 AY 000 Selling Price 15000). 3744 3516 1865 3224...
 One of the biggest factors in determining the value of a home is the square footage. The accompanying data represent the square footage and selling price in thousands of dollars) for a random sample of homes for sale in a certain region. Complete parts (a) through (h) below. square feet, on average. Click the icon to view the housing data. D. For every additional thousand dollars in selling price, the square footage increases by (Round to three decimal places as...
 This Question: 1 pt 10 of 15 (12 complete) A Data Table One of the biggest factors in determining the value of a home dollars) for a random sample of homes for sale. Complete part Es: Click the icon to view the data table. = Click the icon to view a table of critical values for the corre (a) Which variable is the explanatory variable? O A. Determining the value of a home OB Number of homes OC. Asking price...
 (is/is not) (more/less)
Square_Feet Price_($000)
1,166 262
3,079 608
1,565 281
1,066 223
2,067 328
2,386 361
905 187
2,929 431
1,365 284
2,908 565
2,944 412
1,309 289
1,828 305
1,629 313
1,884 324
2,267 438
1,134 233
2,593 509
1,115 258
1,749 325
The accompanying data table contains the listed prices (in thousands of dollars) and the number of square feet for 20 homes listed by a realtor in a certain city. Complete parts a through f below....
(is/is not) (more/less)
Square_Feet Price_($000)
1,166 262
3,079 608
1,565 281
1,066 223
2,067 328
2,386 361
905 187
2,929 431
1,365 284
2,908 565
2,944 412
1,309 289
1,828 305
1,629 313
1,884 324
2,267 438
1,134 233
2,593 509
1,115 258
1,749 325
The accompanying data table contains the listed prices (in thousands of dollars) and the number of square feet for 20 homes listed by a realtor in a certain city. Complete parts a through f below....
 Tests A division of a multinational retail company prepared a presentation to give at the home office in Paris, France. The presentation includes a scatterplot that shows the relationship between square footage and annual sales in retail outlets owned by the chain. The units in the plot show the size in thousands of square feet and the response in thousands of dollars. A fitted line in the plot is y = 48 +683x. Complete parts a through d below. (a)...
 Question 5 10 pts The table below shows the rental price of homes on the coast of New Jersey and their square footage. There are 14 observations. Copy the data into Excel and be sure to use all observations in your analysis. Rental Price Square Feet ($) 875 1400 900 2000 900 1300 1090 1600 1175 1800 1250 2800 1400 1400 2200 1500 1600 1700 1700 1800 2600 1900 2400 2000 2600 1900 1600 2000 Use simple regression analysis to...
 options C and D for the mutiple choice questions are
C: The selling price of this particular house is less than the
predicted value by the amount of the residual.
D: The residual is the predicted selling orice for house with
zero square feet.
For the response variable y, the selling price in thousands of dollars, and the expanatory variable x, the size of the house in thousands of square feet. ý = 9.5 +77 2x. a. How much do...
options C and D for the mutiple choice questions are
C: The selling price of this particular house is less than the
predicted value by the amount of the residual.
D: The residual is the predicted selling orice for house with
zero square feet.
For the response variable y, the selling price in thousands of dollars, and the expanatory variable x, the size of the house in thousands of square feet. ý = 9.5 +77 2x. a. How much do...
Most questions answered within 3 hours.
-
Minitab Problem: Take the Lake Hume June rainfall data and find
use the processes outlined in...
asked 1 minute ago -
X Company is trying to decide whether to continue using old
equipment to make Product A...
asked 2 minutes ago -
IN PYTHON ONLY !! Program 2: Re-work
program #5 (WeeklyHours) from the previous assignment such that...
asked 39 minutes ago -
The average length of time between arrivals at a turnpike
toll-booth is 26 seconds. What is...
asked 2 hours ago -
(a) A piston at 6.1 atm contains a gas that occupies a volume of
3.5 L....
asked 3 hours ago -
Please answer true or false. Words
cannot be changed or added in to make it true...
asked 3 hours ago -
An empty test tube weighs 15.923 grams. Then,
MgCl2•6H2O is added into the test tube. After...
asked 3 hours ago -
Assume memory access is 10 units of time and disk access is
10000 units of time....
asked 3 hours ago -
1. Are all good samples random?
2. Magazines often report surveys giving statistics such as “63%...
asked 4 hours ago -
Under all the various types of market structures, firms
must eventually earn some economic profits for...
asked 3 hours ago -
Consider the following fitness regime for a single locus trait
with two co-dominant alleles: w11 =...
asked 4 hours ago -
A large cable company reports the following.
80% of its customers subscribe to its cable TV...
asked 4 hours ago