
Homework Answers

---------------------------------------------------------------------------------------------------------------------------------------------------

Add Answer to:
4 500 randomly selected automobile owners were current automobile. The results are given below. questioned on...
Five hundred randomly selected automobile owners were questioned on the main reason they had purchased their...
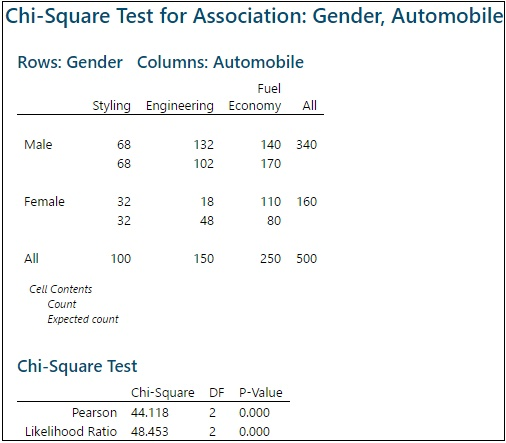
Five hundred randomly selected automobile owners were questioned on the main reason they had purchased their current automobile. The results are given below. Styling Engineering Fuel Economy Total Male 70 130 150 350 Female 30 20 100 150 Total 100 150 250 500 a. State the null and alternative hypotheses for a contingency table test. b. State the decision rule for the critical value approach. Let alpha = .01. c. Calculate the x2 test statistic. d. Give your conclusion for...
4. In this question, you will examine the relationship between survival and gender. (a) Obtain the contingency tab...
 4. In this question, you will examine the relationship between survival and gender. (a) Obtain the contingency table of survival by gender. Make sure that Row percent, Column percent, and Chi-Square options are checked in each contingency table dialog box. Paste the table into your report. Using a = 0.01, test that there was no relationship between survival and gender. State the null and alternative hypotheses. Report the value of the appropriate test statistic, the distribution of the test statistic...
HELP needed urgently....Data and question is attacted below..... Thank you in advance there is no data...
 HELP needed urgently....Data and question is attacted below.....
Thank you in advance
there is no data link fir this data it’s all in photos.... thank
you
i
have already posted the question
We were unable to transcribe this imageNo. 2 3 4 5 6 7 8 Working Sector Public Own Public Public Private Public Private Private Own Own Private Public Public Public Private 9 10 11 12 13 Public IS 16 17 18 19 20 21 22 23 24 25...
HELP needed urgently....Data and question is attacted below.....
Thank you in advance
there is no data link fir this data it’s all in photos.... thank
you
i
have already posted the question
We were unable to transcribe this imageNo. 2 3 4 5 6 7 8 Working Sector Public Own Public Public Private Public Private Private Own Own Private Public Public Public Private 9 10 11 12 13 Public IS 16 17 18 19 20 21 22 23 24 25...
 4. In this question, you will examine the relationship between survival and gender. (a) Obtain the contingency table of survival by gender. Make sure that Row percent, Column percent, and Chi-Square options are checked in each contingency table dialog box. Paste the table into your report. Using a = 0.01, test that there was no relationship between survival and gender. State the null and alternative hypotheses. Report the value of the appropriate test statistic, the distribution of the test statistic...
 HELP needed urgently....Data and question is attacted below.....
Thank you in advance
there is no data link fir this data it’s all in photos.... thank
you
i
have already posted the question
We were unable to transcribe this imageNo. 2 3 4 5 6 7 8 Working Sector Public Own Public Public Private Public Private Private Own Own Private Public Public Public Private 9 10 11 12 13 Public IS 16 17 18 19 20 21 22 23 24 25...
HELP needed urgently....Data and question is attacted below.....
Thank you in advance
there is no data link fir this data it’s all in photos.... thank
you
i
have already posted the question
We were unable to transcribe this imageNo. 2 3 4 5 6 7 8 Working Sector Public Own Public Public Private Public Private Private Own Own Private Public Public Public Private 9 10 11 12 13 Public IS 16 17 18 19 20 21 22 23 24 25...
Most questions answered within 3 hours.
-
X Company is trying to decide whether to continue using old
equipment to make Product A...
asked 22 minutes ago -
Minitab Problem: Take the Lake Hume June rainfall data and find
use the processes outlined in...
asked 21 minutes ago -
IN PYTHON ONLY !! Program 2: Re-work
program #5 (WeeklyHours) from the previous assignment such that...
asked 59 minutes ago -
The average length of time between arrivals at a turnpike
toll-booth is 26 seconds. What is...
asked 2 hours ago -
(a) A piston at 6.1 atm contains a gas that occupies a volume of
3.5 L....
asked 3 hours ago -
Please answer true or false. Words
cannot be changed or added in to make it true...
asked 3 hours ago -
An empty test tube weighs 15.923 grams. Then,
MgCl2•6H2O is added into the test tube. After...
asked 3 hours ago -
Assume memory access is 10 units of time and disk access is
10000 units of time....
asked 4 hours ago -
1. Are all good samples random?
2. Magazines often report surveys giving statistics such as “63%...
asked 4 hours ago -
Under all the various types of market structures, firms
must eventually earn some economic profits for...
asked 4 hours ago -
Consider the following fitness regime for a single locus trait
with two co-dominant alleles: w11 =...
asked 4 hours ago -
A large cable company reports the following.
80% of its customers subscribe to its cable TV...
asked 4 hours ago