

Homework Answers

![7. 60.5-0.11) [.100.10) No No 03] V 08 -0.01 11-10 ✓ OB 2 395-4103 2: -0.91 0.0795 [7--0.894] 7 = - 3.89 Therefore test (stat](http://img.homeworklib.com/questions/01040fb0-aeef-11eb-9345-afe6f7dde965.png?x-oss-process=image/resize,w_560)
![Lol of the generale about lofth coepol that Abozcuired information ilgilen by X: (190 D 1008 p=4+1 100 [p = 0.47] - Populatio](http://img.homeworklib.com/questions/02d067c0-aeef-11eb-99ea-e1b20dfe7312.png?x-oss-process=image/resize,w_560)
![0.41861 - 0:41] 7 1006 0.0161 O YO.53 1008 clo o. CY 1008 V 2. 006) 9.091230-10-4 0.016! 015120 Z1.0941 =1021 Therefore Kompl](http://img.homeworklib.com/questions/035e0f00-aeef-11eb-af81-d7bb35f8d462.png?x-oss-process=image/resize,w_560)

Add Answer to:
The U.S. Department of Transportation, National Highway
Traffic Safety Administration, reported that 77% of all fatally...
The U.S. Department of Transportation, National Highway Traffic Safety Administration, reported that 77% of all fatally...
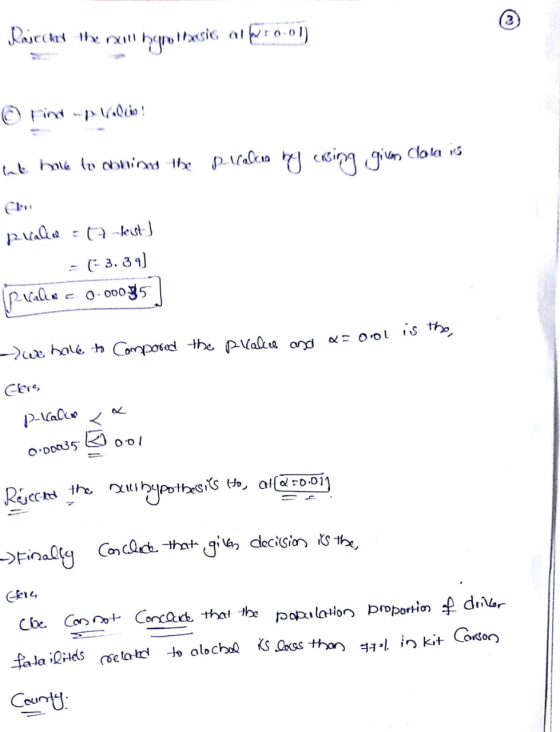
The U.S. Department of Transportation, National Highway Traffic Safety Administration, reported that 77% of all fatally injured automobile drivers were intoxicated. A random sample of 31 records of automobile driver fatalities in Kit Carson County, Colorado, showed that 18 involved an intoxicated driver. Do these data indicate that the population proportion of driver fatalities related to alcohol is less than 77% in Kit Carson County? Use α = 0.01. Solve the problem using both the traditional method and the P-value...
17. The U.S. Department of Transportation reported that 77% of all fatally injured automobile drivers were...
 17. The U.S. Department of Transportation reported that 77% of all fatally injured automobile drivers were intoxicated. A random sample of 27 records of automobile driver fatalities in Kit Carson County, Colorado, showed that 15 involved an intoxicated driver. Do these data indicate that the population proportion of driver fatalities related to alcohol is less than 77% in Kit Carson County? Use a=.01. a) State the null and alternate hypotheses. b) What sampling distribution will you use? c) Compute the...
The us. Department Transportation National ghway aff c Safety Adr i istration, eported that 77% of...
 The us. Department Transportation National ghway aff c Safety Adr i istration, eported that 77% of all at ally i ured auto mo e verswe e nto cated Aranao driver Do these data indicate that the population proportion of driver fatait es related to alcohol is less than 77% in Kit Carson County? Use α-0.10. sample of 55 ecots o autom ble drive a a tesi ace an county showed that 37 in ed an int icated )What is the...
USA Today reported that about 47% of the general population in the United States is loyal...
 USA Today reported that about 47% of the general population in the United States is loyal to the automobile study of a random sample of 1002 Chevrolet owners and found that 489 said they would buy another Chevrolet. Does this indicate that the population proportion of consumers loyal to Chevrolet is more than 47%? Use α = 0.01 (a) What is the level of significance? OHo: p-0.47; H,: p 0.47 O Ho: p-0.47; H,: p> 0.47 O Ho: p >...
USA Today reported that about 47% of the general consumer population in the United States is...
USA Today reported that about 47% of the general consumer population in the United States is loyal to the automobile manufacturer of their choice. Suppose Chevrolet did a study of a random sample of 987 Chevrolet owners and found that 494 said they would buy another Chevrolet. Does this indicate that the population proportion of consumers loyal to the car company is more than 47%? Use α = 0.01. Solve the problem using both the traditional method and the P-value...
reported that about 47% ofthe general consumer population in the United States is loyal to the...
 reported that about 47% ofthe general consumer population in the United States is loyal to the automobile sahathcy would buy another Chevrolet. Test the claim by Chevrolet that the population proportion of 4 USAT d sample of 1006 Chevrolet owners and found manufacturer of their choice. Suppose that Chevrolet did a study of a randonm consumers loyal to its product is more than 47%. Use ax-005. (a) State the null (Ho) and alternate (HA) hypotheses. (b) Check the assumptions. (c)...
1.) Is the national crime rate really going down? Some sociologists say yes! They say that...
1.) Is the national crime rate really going down? Some sociologists say yes! They say that the reason for the decline in crime rates in the 1980s and 1990s is demographics. It seems that the population is aging, and older people commit fewer crimes. According to the FBI and the Justice Department, 70% of all arrests are of males aged 15 to 34 years.† Suppose you are a sociologist in Rock Springs, Wyoming, and a random sample of police files...
The National Highway Traffic Safety Administration reported the percentage of traffic accidents occurring each day of...
 The National Highway Traffic Safety Administration reported the percentage of traffic accidents occurring each day of the week. Assume that a sample of 420 accidents provided the following data Sunday Monday Tues day Wednesday Thursday riday Saturday 50 53 47 69 (a) Conduct a hypothesis test to determine if the proportion of traffic accidents is the same for each day of the week. Use a 0.05 level of significance. State the null and alternative hypotheses. Ho: Not all proportions are...
thanks for your help The National Highway Traffic Safety Administration reported the percentage of traffic accidents...
 thanks for your help
The National Highway Traffic Safety Administration reported the percentage of traffic accidents occurring each day of the week. Assume that a sample of 420 accidents provided the following data Sunday Monday Tuesday Wednesday Thursday Friday Saturday 65 52 54 45 52 72 80 a. Conduct a hypothesis test to determine if the proportion of traffic accidents is the same for each day of the week. What is the p value? Compute the value of the test...
thanks for your help
The National Highway Traffic Safety Administration reported the percentage of traffic accidents occurring each day of the week. Assume that a sample of 420 accidents provided the following data Sunday Monday Tuesday Wednesday Thursday Friday Saturday 65 52 54 45 52 72 80 a. Conduct a hypothesis test to determine if the proportion of traffic accidents is the same for each day of the week. What is the p value? Compute the value of the test...
The National Highway Traffic Safety Administration (NHTSA) claims that, in a car accident, Tesla passengers are...
The National Highway Traffic Safety Administration (NHTSA) claims that, in a car accident, Tesla passengers are less likely to be injured than their non-Tesla counterparts. They select a random sample of 200 Tesla passengers and 400 non-Tesla passengers who were in a car accident. From their data, they found that 5.5% of the Tesla passengers and 9% of the non-Tesla passengers were injured. Test the NHTSA’s claim at a 10% significance level. a) Define Population 1 and Population 2. b)...
 17. The U.S. Department of Transportation reported that 77% of all fatally injured automobile drivers were intoxicated. A random sample of 27 records of automobile driver fatalities in Kit Carson County, Colorado, showed that 15 involved an intoxicated driver. Do these data indicate that the population proportion of driver fatalities related to alcohol is less than 77% in Kit Carson County? Use a=.01. a) State the null and alternate hypotheses. b) What sampling distribution will you use? c) Compute the...
 The us. Department Transportation National ghway aff c Safety Adr i istration, eported that 77% of all at ally i ured auto mo e verswe e nto cated Aranao driver Do these data indicate that the population proportion of driver fatait es related to alcohol is less than 77% in Kit Carson County? Use α-0.10. sample of 55 ecots o autom ble drive a a tesi ace an county showed that 37 in ed an int icated )What is the...
 USA Today reported that about 47% of the general population in the United States is loyal to the automobile study of a random sample of 1002 Chevrolet owners and found that 489 said they would buy another Chevrolet. Does this indicate that the population proportion of consumers loyal to Chevrolet is more than 47%? Use α = 0.01 (a) What is the level of significance? OHo: p-0.47; H,: p 0.47 O Ho: p-0.47; H,: p> 0.47 O Ho: p >...
 reported that about 47% ofthe general consumer population in the United States is loyal to the automobile sahathcy would buy another Chevrolet. Test the claim by Chevrolet that the population proportion of 4 USAT d sample of 1006 Chevrolet owners and found manufacturer of their choice. Suppose that Chevrolet did a study of a randonm consumers loyal to its product is more than 47%. Use ax-005. (a) State the null (Ho) and alternate (HA) hypotheses. (b) Check the assumptions. (c)...
 The National Highway Traffic Safety Administration reported the percentage of traffic accidents occurring each day of the week. Assume that a sample of 420 accidents provided the following data Sunday Monday Tues day Wednesday Thursday riday Saturday 50 53 47 69 (a) Conduct a hypothesis test to determine if the proportion of traffic accidents is the same for each day of the week. Use a 0.05 level of significance. State the null and alternative hypotheses. Ho: Not all proportions are...
 thanks for your help
The National Highway Traffic Safety Administration reported the percentage of traffic accidents occurring each day of the week. Assume that a sample of 420 accidents provided the following data Sunday Monday Tuesday Wednesday Thursday Friday Saturday 65 52 54 45 52 72 80 a. Conduct a hypothesis test to determine if the proportion of traffic accidents is the same for each day of the week. What is the p value? Compute the value of the test...
thanks for your help
The National Highway Traffic Safety Administration reported the percentage of traffic accidents occurring each day of the week. Assume that a sample of 420 accidents provided the following data Sunday Monday Tuesday Wednesday Thursday Friday Saturday 65 52 54 45 52 72 80 a. Conduct a hypothesis test to determine if the proportion of traffic accidents is the same for each day of the week. What is the p value? Compute the value of the test...
Most questions answered within 3 hours.
-
4. Without doing any calculations, predict whether the observed
∆T would increase, decrease or remain the...
asked 54 minutes ago -
Based on the range, which of the following sets of scores has
the greatest variability? 3,...
asked 2 hours ago -
Ripples in a pond travel at a velocity of 3 m/s with one peak
passing a...
asked 1 hour ago -
A man stands on the roof of a building of height 13.0 mm and
throws a...
asked 1 hour ago -
The extent to which assets are financed by borrowed funds and
other liabilities is indicated by:...
asked 3 hours ago -
Explain in detail
Germany is the fifth largest economy
explain what goods and services Germany specializes...
asked 3 hours ago -
The density of platinum is 21.45 g/mL. If a cube of platinum
with a mass of...
asked 3 hours ago -
Accounts Receivable
Sales
A/R Posting
Extended Sales Invoice
Packing Slip
Compare invoice to packing slip 2...
asked 3 hours ago -
Michaella, age 23, is a full-time law student and is claimed by
her parents as a...
asked 3 hours ago -
Why are polymers not typically casted into products?
asked 3 hours ago -
When rolling a die 129 times, what is the probability of rolling
a 6 no more...
asked 3 hours ago -
4. A call option currently sells for $7.75. It has a strike
price of $85 and...
asked 3 hours ago