
Homework Answers
Sol:
1:
Since each bag is independent from other so probability of getting blue ball time is
P(B) = 0.24, P(N) = 1 -0.24 = 0.76
Each ball can be blue or not blue so according to fundamental principe of counting total number of outcomes is
2 *2*2*2 = 16
Following is the tree diagram of the four draws (one from each bag):
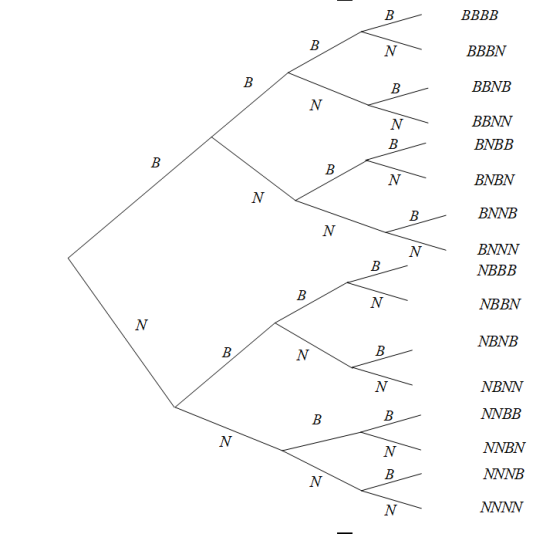
Here outcome NNNB shows the balls from first three bags are not blue and ball from last bag is blue.
2)
Yes it is binomial experiment. Let X is a radnom variable shows the number of blue balls out of 4. Here X has binomial distribution with parameters n=4 and p=0.24.
The pdf of X is

3)
The probabilites are:


Following table shows the required probability;
| X | P(X=x) |
| 0 | 0.3336 |
| 1 | 0.4214 |
| 2 | 0.1996 |
| 3 | 0.042 |
| 4 | 0.0033 |
-----------
4:
The mean is

The standard deviation is

5:
(a)
The probabiluty that at least three candies will be blue in this experiment is

(b)

Add Answer to:
Bags of plain M&Ms contain 24% blue candies. You have four bags of candy and select...
on the m&m's website, the company states that 24% of the m&m candies in the plain...
 on the m&m's website, the company states that 24% of the m&m candies in the plain brown bag are the color blue. The standard deviation in the factory for blue vs. not blue m&m's candies is, therefore, 0.24 0.76 0.43. Suppose you randomly selected 25 plain brown bags of m&m's. Suppose also that each bag contains exactly 58 m&m candies. For each bag, you also calculate the proportion of blue m&m's candies. How many of these bags, on average, will...
Sally's mother has two bags of candy but she says that Sally can only have one...
Sally's mother has two bags of candy but she says that Sally can only have one piece from each bag. Bag #1 has 70% orange candies and 30% red candies. Bag #2 has 10% orange candies, 50% white candies, and the rest are red candies. Sally's eyes are covered and she chooses one piece of candy from each bag. What is the probability that she chooses the sam color from both bags. Make a tree diagram or area model to...
A sample of 14 small bags of the same brand of candies was selected. Assume that...
A sample of 14 small bags of the same brand of candies was selected. Assume that the population distribution of bag weights is normal. The weight of each bag was then recorded. The mean weight was 3 ounces with a standard deviation of 0.15 ounces. The population standard deviation is known to be 0.1 ounce. NOTE: If you are using a Student's t-distribution, you may assume that the underlying population is normally distributed. (In general, you must first prove that...
1.Suppose we have two bowls full of candies. Each bowl contains four different flavours of candy...
1.Suppose we have two bowls full of candies. Each bowl contains four different flavours of candy – grape (which are purple), lemon (which are yellow), cherry (which are red) and raspberry (which are also red). (a) [1 Mark] We will randomly select one candy from each bowl. The outcome of interest is the flavour of each of the two candies. Write out the complete sample space of outcomes. (b) [1 Mark] Suppose instead that we randomly select one candy from...
8, on the m&m's website, the company states that 24% of the m&m candies in the...
 8, on the m&m's website, the company states that 24% of the m&m candies in the plain brown bag are the color blue. The standard deviation in the factory for blue vs. not blue m&m's candies is, therefore, v0.24*0.76 0.43. Suppose you randomly selected 25 plain brown bags of m&m's. Suppose also that each bag contains exactly 58 m&m candies. For each bag, you also calculate the proportion of blue m&m's candies. How many of these bags, on average, will...
Consider: two unopened bags of candy (one Skittles, the other M&M's). The manufacturers state the distribution...
Consider: two unopened bags of candy (one Skittles, the other M&M's). The manufacturers state the distribution of coloured candies is: M&M's: 23% blue, 21% orange, 17% green, 13% yellow, 12% red, 14% brown Skittles: colours are reportedly distributed evenly, meaning each colour (red, orange, green, blue, yellow, and purple) has a probability of 1/6. Assume that both of these unopened bags have the same number of candies. If they are opened and mixed, and one candy is randomly selected, what...
8. [-18 Points] DETAILS BBBASICSTAT6 5.2.013. M M&M plain candies come in various colors. According to...
 8. [-18 Points] DETAILS BBBASICSTAT6 5.2.013. M M&M plain candies come in various colors. According to the M&M/Mars Department of Consumer Affairs, the distribution of colors for plain M&M candies is as follows. Color Purple Yellow Red Orange Green Blue Brown Percentage 17% 23% 22% 10% 7% 7% 14% Suppose you have a large bag of plain M&M candies and you choose one candy at random. (a) Find P(green candy or blue candy). Are these outcomes mutually exclusive? Why? O...
A sample of 13 small bags of the same brand of candies was selected. Assume that...
A sample of 13 small bags of the same brand of candies was selected. Assume that the population distribution of bag weights is normal. The weight of each bag was then recorded. The mean weight was 2 ounces with a standard deviation of 0.12 ounces. The population standard deviation is known to be 0.1 ounce. NOTE: If you are using a Student's t-distribution, you may assume that the underlying population is normally distributed. (In general, you must first prove that...
discrete math 1) a. A box contains 4 marbles: 1 red, 1 blue, 1 green, 1...
 discrete math
1) a. A box contains 4 marbles: 1 red, 1 blue, 1 green, 1 yellow. Consider an experiment that consists of taking 1 marble from the box, replacing it and then drawing a second marble. Describe the sample space. How does the sample space differ if the first marble was not replaced before the second marble was drawn? (2 marks) a. A bag contains 5 red balls and 8 blue balls. Each time a ball is selected, its...
discrete math
1) a. A box contains 4 marbles: 1 red, 1 blue, 1 green, 1 yellow. Consider an experiment that consists of taking 1 marble from the box, replacing it and then drawing a second marble. Describe the sample space. How does the sample space differ if the first marble was not replaced before the second marble was drawn? (2 marks) a. A bag contains 5 red balls and 8 blue balls. Each time a ball is selected, its...
 on the m&m's website, the company states that 24% of the m&m candies in the plain brown bag are the color blue. The standard deviation in the factory for blue vs. not blue m&m's candies is, therefore, 0.24 0.76 0.43. Suppose you randomly selected 25 plain brown bags of m&m's. Suppose also that each bag contains exactly 58 m&m candies. For each bag, you also calculate the proportion of blue m&m's candies. How many of these bags, on average, will...
 8, on the m&m's website, the company states that 24% of the m&m candies in the plain brown bag are the color blue. The standard deviation in the factory for blue vs. not blue m&m's candies is, therefore, v0.24*0.76 0.43. Suppose you randomly selected 25 plain brown bags of m&m's. Suppose also that each bag contains exactly 58 m&m candies. For each bag, you also calculate the proportion of blue m&m's candies. How many of these bags, on average, will...
 8. [-18 Points] DETAILS BBBASICSTAT6 5.2.013. M M&M plain candies come in various colors. According to the M&M/Mars Department of Consumer Affairs, the distribution of colors for plain M&M candies is as follows. Color Purple Yellow Red Orange Green Blue Brown Percentage 17% 23% 22% 10% 7% 7% 14% Suppose you have a large bag of plain M&M candies and you choose one candy at random. (a) Find P(green candy or blue candy). Are these outcomes mutually exclusive? Why? O...
 discrete math
1) a. A box contains 4 marbles: 1 red, 1 blue, 1 green, 1 yellow. Consider an experiment that consists of taking 1 marble from the box, replacing it and then drawing a second marble. Describe the sample space. How does the sample space differ if the first marble was not replaced before the second marble was drawn? (2 marks) a. A bag contains 5 red balls and 8 blue balls. Each time a ball is selected, its...
discrete math
1) a. A box contains 4 marbles: 1 red, 1 blue, 1 green, 1 yellow. Consider an experiment that consists of taking 1 marble from the box, replacing it and then drawing a second marble. Describe the sample space. How does the sample space differ if the first marble was not replaced before the second marble was drawn? (2 marks) a. A bag contains 5 red balls and 8 blue balls. Each time a ball is selected, its...
Most questions answered within 3 hours.
-
MATLAB HW 11 problem using Switch Case and Input commands
Write a script file that calculates...
asked 10 seconds ago -
A college student is employed as a door-to-door newspaper
salesman. Historical data suggests that the student...
asked 14 minutes ago -
Considering gravitational time dilation, calculate the time that
passes in Earth’s surface while 1 hour passes...
asked 38 minutes ago -
Minitab Problem: Take the Lake Hume June rainfall data and find
use the processes outlined in...
asked 1 hour ago -
X Company is trying to decide whether to continue using old
equipment to make Product A...
asked 1 hour ago -
IN PYTHON ONLY !! Program 2: Re-work
program #5 (WeeklyHours) from the previous assignment such that...
asked 2 hours ago -
The average length of time between arrivals at a turnpike
toll-booth is 26 seconds. What is...
asked 3 hours ago -
(a) A piston at 6.1 atm contains a gas that occupies a volume of
3.5 L....
asked 5 hours ago -
Please answer true or false. Words
cannot be changed or added in to make it true...
asked 4 hours ago -
An empty test tube weighs 15.923 grams. Then,
MgCl2•6H2O is added into the test tube. After...
asked 5 hours ago -
Assume memory access is 10 units of time and disk access is
10000 units of time....
asked 5 hours ago -
1. Are all good samples random?
2. Magazines often report surveys giving statistics such as “63%...
asked 5 hours ago