
Homework Answers
Answer:
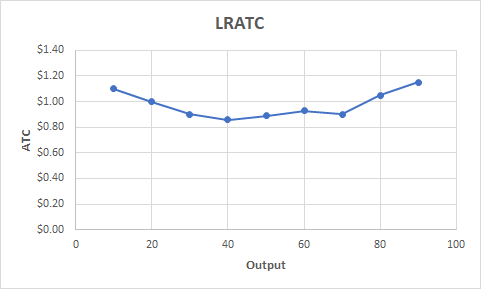
(a) The Long Run Total Cost refers to the lowest cost of producing a good at each level of output and firms build the most appropriate plant to produce the most efficient level of output.
The Long Run Average Cost Schedule (LRATC) is determined by the lease cost of producing a good at each level of output from all the three plant sizes.
The LRATC Schedule is as under:
| Output | LRATC |
| 10 | $1.10 |
| 20 | $1.00 |
| 30 | $0.90 |
| 40 | $0.86 |
| 50 | $0.89 |
| 60 | $0.93 |
| 70 | $0.90 |
| 80 | $1.05 |
| 90 | $1.15 |
(b) The required graph showing the three possible plant sizes, using the three different ATC values on the same graph is as under:
| Output | Plant Size 1 ATC | Output | Plant Size 2 ATC | Output | Plant Size 3 ATC |
| 10 | $1.10 | 20 | $1.05 | 40 | $1.10 |
| 20 | $1.00 | 30 | $0.90 | 50 | $0.97 |
| 30 | $0.95 | 40 | $0.86 | 60 | $0.94 |
| 40 | $0.98 | 50 | $0.89 | 70 | $0.90 |
| 50 | $1.03 | 60 | $0.93 | 80 | $1.05 |
| 60 | $1.15 | 70 | $1.00 | 90 | $1.15 |

(c) The LRATC graph based on the results above is as under:
Add Answer to:
Size 1 Output ATC 10 $1.10 20 1.00 30 0.95 40 0.98 50 1.03 60 1.15...
$20 ATC 15 10 5 0 10 20 30 40 50 Quantity 60 70 80 Refer...
 $20 ATC 15 10 5 0 10 20 30 40 50 Quantity 60 70 80 Refer to the diagram showing the average total cost curve for a purely competitive firm. At the long-run equilibrium level of output, this firm's economic profit: is zero is $400 O is $200 cannot be determined from the information provided.
Table 1 shows the three short-run average total cost (ATC) curves for a firm with only...
 Table 1 shows the three short-run average total cost (ATC) curves for a firm with only three possible plant sizes: (1) Size 1, (2) Size 2, and (3) Size 3. Find the firm's long-run average cost (LRAC) curve and answer Questions 17- 21 on the basis of the information in Table 1 Table 1 Only Three Possible Plant Sizes Long-Run Average Cost Curve LRAC Size 1 Size 2 QI ATC 20 S0.95 30 40 50 60 70 Size 3 Size...
P $70 $65 $60 $55 $50 ATC $45 $40 $35 AVC MR $30 $25 $20 $15...
 P $70 $65 $60 $55 $50 ATC $45 $40 $35 AVC MR $30 $25 $20 $15 $10 $5 01234 56789 10 11 12 13 14 Based on the graph above, what is the profit maximizing price? o $45 $25 $5 S40 O $20 $10 $70 $50 S60 $65 S55 SI5 S30 $35
Repeat units 20 30 40 50 60 70 # of chains 24 12 10 1) Above is a table of a size distribution fo...
 Repeat units 20 30 40 50 60 70 # of chains 24 12 10 1) Above is a table of a size distribution for the polymer in question 1 (formula weight is 43 g/mo). Compute PD. (use a spreadsheet)
Repeat units 20 30 40 50 60 70 # of chains 24 12 10 1) Above is a table of a size distribution for the polymer in question 1 (formula weight is 43 g/mo). Compute PD. (use a spreadsheet)
Repeat units 20 30 40 50 60 70 # of chains 24 12 10 1) Above is a table of a size distribution for the polymer in question 1 (formula weight is 43 g/mo). Compute PD. (use a spreadsheet)
Use the graph to answer (A) through (F) 80 70 60 50 40 30 20 10...
 Use the graph to answer (A) through (F)
80 70 60 50 40 30 20 10 State the equation for the demand curve (inverse demand function) shown in the graph above using the format P-a-bQ a. b. State the equation for the demand function implied in the graph ysing the format Q-c-dP. c. Find the equation for Total Revenue, where TR is a function of output (Q) d. Find the equation for Marginal Revenue, where MR is a function of...
Use the graph to answer (A) through (F)
80 70 60 50 40 30 20 10 State the equation for the demand curve (inverse demand function) shown in the graph above using the format P-a-bQ a. b. State the equation for the demand function implied in the graph ysing the format Q-c-dP. c. Find the equation for Total Revenue, where TR is a function of output (Q) d. Find the equation for Marginal Revenue, where MR is a function of...
1. Use the graph below to answer the questions: 80 70 60 50 40 30 20...
 1. Use the graph below to answer the questions: 80 70 60 50 40 30 20 10 ㄒ ㄧ -- 4 State the equation for the demand curve (inverse demand function) shown in the graph above using the format Px- a - bQx: a. b. State the equation for the demand function implied in the graph using the format Qx-c - dPx c. Find the equation for Total Revenue, where TR is a function of output (Qx) d. Find the...
Graph 6-7 Price 8 +----- 6+----- 5 +----- A + - - - - - - - - - - - W N – o 10 20 30 40 50 60 70 Quantity 13. According...
 Graph 6-7 Price 8 +----- 6+----- 5 +----- A + - - - - - - - - - - - W N – o 10 20 30 40 50 60 70 Quantity 13. According to Graph 6-7, the amount of the tax that buyers would pay would be: A. $1.00 B. $1.50 C. $2.00 D. $3.00 14. According to Graph 6-7, the amount of the tax that sellers would pay would be: A. $1.00 B. $1.50 C. $2.00 D....
100 90 1 2. BO 70 60 COST 50 40 30 20 10 D MR 25...
 100 90 1 2. BO 70 60 COST 50 40 30 20 10 D MR 25 35 45 50 1 60 55 OUTPUT Curve 1 should be labeled Curve 2 should be labeled Firms maximize profit where The profit maximizing price for the firm is while the profit maximizing output for the firm is (approximations are fine) Question 27 2 pts Why should a firm never hire a worker when negative marginal returns exist? Hiring an additional worker will increase...
#1 1. A firm has the following demand and total cost schedule. TR Profit MR MC O 0 10 20 30 40 50 60 P 100 90 80 70...
 #1
1. A firm has the following demand and total cost schedule. TR Profit MR MC O 0 10 20 30 40 50 60 P 100 90 80 70 60 50 40 TC 200 400 600 800 800 1,000 1.200 1.400 a) Is the firm a price-taker or price searcher? Explain. b) Complete the Total Revenue (TR) and Profit schedules. c) How many units of output (Q) should the firm produce to maximize profits? d) What price (P) should the...
#1
1. A firm has the following demand and total cost schedule. TR Profit MR MC O 0 10 20 30 40 50 60 P 100 90 80 70 60 50 40 TC 200 400 600 800 800 1,000 1.200 1.400 a) Is the firm a price-taker or price searcher? Explain. b) Complete the Total Revenue (TR) and Profit schedules. c) How many units of output (Q) should the firm produce to maximize profits? d) What price (P) should the...
1. Use the graph below to answer the questions: 80 70 60 50 40 30 20...
 1. Use the graph below to answer the questions: 80 70 60 50 40 30 20 10 State the equation for the demand curve (inverse demand function) shown in the graph above using the format P a-bQi a. b. State the equation for the demand function implied in the graph using the format Q c-dP Find the equation for Total Revenue, where TR is a function of output (Q): c. d. Find the equation for Marginal Revenue, where MR is...
 $20 ATC 15 10 5 0 10 20 30 40 50 Quantity 60 70 80 Refer to the diagram showing the average total cost curve for a purely competitive firm. At the long-run equilibrium level of output, this firm's economic profit: is zero is $400 O is $200 cannot be determined from the information provided.
 Table 1 shows the three short-run average total cost (ATC) curves for a firm with only three possible plant sizes: (1) Size 1, (2) Size 2, and (3) Size 3. Find the firm's long-run average cost (LRAC) curve and answer Questions 17- 21 on the basis of the information in Table 1 Table 1 Only Three Possible Plant Sizes Long-Run Average Cost Curve LRAC Size 1 Size 2 QI ATC 20 S0.95 30 40 50 60 70 Size 3 Size...
 P $70 $65 $60 $55 $50 ATC $45 $40 $35 AVC MR $30 $25 $20 $15 $10 $5 01234 56789 10 11 12 13 14 Based on the graph above, what is the profit maximizing price? o $45 $25 $5 S40 O $20 $10 $70 $50 S60 $65 S55 SI5 S30 $35
 Repeat units 20 30 40 50 60 70 # of chains 24 12 10 1) Above is a table of a size distribution for the polymer in question 1 (formula weight is 43 g/mo). Compute PD. (use a spreadsheet)
Repeat units 20 30 40 50 60 70 # of chains 24 12 10 1) Above is a table of a size distribution for the polymer in question 1 (formula weight is 43 g/mo). Compute PD. (use a spreadsheet)
Repeat units 20 30 40 50 60 70 # of chains 24 12 10 1) Above is a table of a size distribution for the polymer in question 1 (formula weight is 43 g/mo). Compute PD. (use a spreadsheet)
 Use the graph to answer (A) through (F)
80 70 60 50 40 30 20 10 State the equation for the demand curve (inverse demand function) shown in the graph above using the format P-a-bQ a. b. State the equation for the demand function implied in the graph ysing the format Q-c-dP. c. Find the equation for Total Revenue, where TR is a function of output (Q) d. Find the equation for Marginal Revenue, where MR is a function of...
Use the graph to answer (A) through (F)
80 70 60 50 40 30 20 10 State the equation for the demand curve (inverse demand function) shown in the graph above using the format P-a-bQ a. b. State the equation for the demand function implied in the graph ysing the format Q-c-dP. c. Find the equation for Total Revenue, where TR is a function of output (Q) d. Find the equation for Marginal Revenue, where MR is a function of...
 1. Use the graph below to answer the questions: 80 70 60 50 40 30 20 10 ㄒ ㄧ -- 4 State the equation for the demand curve (inverse demand function) shown in the graph above using the format Px- a - bQx: a. b. State the equation for the demand function implied in the graph using the format Qx-c - dPx c. Find the equation for Total Revenue, where TR is a function of output (Qx) d. Find the...
 Graph 6-7 Price 8 +----- 6+----- 5 +----- A + - - - - - - - - - - - W N – o 10 20 30 40 50 60 70 Quantity 13. According to Graph 6-7, the amount of the tax that buyers would pay would be: A. $1.00 B. $1.50 C. $2.00 D. $3.00 14. According to Graph 6-7, the amount of the tax that sellers would pay would be: A. $1.00 B. $1.50 C. $2.00 D....
 100 90 1 2. BO 70 60 COST 50 40 30 20 10 D MR 25 35 45 50 1 60 55 OUTPUT Curve 1 should be labeled Curve 2 should be labeled Firms maximize profit where The profit maximizing price for the firm is while the profit maximizing output for the firm is (approximations are fine) Question 27 2 pts Why should a firm never hire a worker when negative marginal returns exist? Hiring an additional worker will increase...
 #1
1. A firm has the following demand and total cost schedule. TR Profit MR MC O 0 10 20 30 40 50 60 P 100 90 80 70 60 50 40 TC 200 400 600 800 800 1,000 1.200 1.400 a) Is the firm a price-taker or price searcher? Explain. b) Complete the Total Revenue (TR) and Profit schedules. c) How many units of output (Q) should the firm produce to maximize profits? d) What price (P) should the...
#1
1. A firm has the following demand and total cost schedule. TR Profit MR MC O 0 10 20 30 40 50 60 P 100 90 80 70 60 50 40 TC 200 400 600 800 800 1,000 1.200 1.400 a) Is the firm a price-taker or price searcher? Explain. b) Complete the Total Revenue (TR) and Profit schedules. c) How many units of output (Q) should the firm produce to maximize profits? d) What price (P) should the...
 1. Use the graph below to answer the questions: 80 70 60 50 40 30 20 10 State the equation for the demand curve (inverse demand function) shown in the graph above using the format P a-bQi a. b. State the equation for the demand function implied in the graph using the format Q c-dP Find the equation for Total Revenue, where TR is a function of output (Q): c. d. Find the equation for Marginal Revenue, where MR is...
Most questions answered within 3 hours.
-
284 mL of a 0.52 M potassium hydroxide solution is added to 467
mL of a...
asked 22 minutes ago -
exercise on VSEPR and molecular structrue.
octahedral
SeCl62-
TeCl62-
ClF62-
distorted
SeF62–
IF6–
asked 23 minutes ago -
Little’s Law: Val d’Costa is a world famous ski village in the
French Alps. Because of...
asked 1 hour ago -
Find the absolute error D for the calculation if A + B/C=D A=
9.4 +/- 0.4...
asked 1 hour ago -
New Air Heating and Cooling, manufactures furnaces and central
air units. The company pride itself on...
asked 1 hour ago -
A coach uses a new technique to train gymnasts. Seven
gymnasts were randomly selected and their...
asked 3 hours ago -
While rotating the tires on your car you notice a rock [mass =
0.1 Kg] stuck...
asked 5 hours ago -
Using MARS simulator, write MIPS programs according to
the following scenarios: Receive a positive integer number...
asked 7 hours ago -
An object in front of a concave mirror has a real image that is
11.5 cm...
asked 7 hours ago -
Consider the reaction, C3 H8 + O2 --> CO2 + H2O. How many
moles of O2...
asked 9 hours ago -
You and your opponent both roll a fair die. If you both roll the
same number,...
asked 9 hours ago -
In a study of the accuracy of fast food drive-through orders,
Restaurant A had 257 accurate...
asked 9 hours ago