
Homework Answers
 thumbs up please
If you have any doubt regarding this particular question then please comment
Add Answer to:
graphical solution for example 3.3
nt Example 3.3 Graphical solution for Example 3.3
In Example 3.3 and the acceleration of the translating piston at the given instanu if a,-10p...
 In Example 3.3 and the acceleration of the translating piston at the given instanu if a,-10p rad/sec and α.-55 rad/sec . see Figure ExAMPLE 3.11 of the translating piston at the given instanr 13in, h 62 Figure E3.11
4. (40%) using the graphical method find the solution for the following problem. Verify this solution using the KKT...
 4. (40%) using the graphical method find the solution for the following problem. Verify this solution using the KKT requirements. Plot the gradients of the objective function and the active constraints at the optimal point MinfcX,y)- (x-3)2 (Y-3) s.t 9:X+2Y-6s 92: 2X+Y-6s0
4. (40%) using the graphical method find the solution for the following problem. Verify this solution using the KKT requirements. Plot the gradients of the objective function and the active constraints at the optimal point MinfcX,y)- (x-3)2 (Y-3)...
4. (40%) using the graphical method find the solution for the following problem. Verify this solution using the KKT requirements. Plot the gradients of the objective function and the active constraints at the optimal point MinfcX,y)- (x-3)2 (Y-3) s.t 9:X+2Y-6s 92: 2X+Y-6s0
4. (40%) using the graphical method find the solution for the following problem. Verify this solution using the KKT requirements. Plot the gradients of the objective function and the active constraints at the optimal point MinfcX,y)- (x-3)2 (Y-3)...
Analyze Example 3.3. Find the entropy change for ideal gas if you can control/measure the pressure...
 Analyze Example 3.3. Find the entropy change for ideal gas if you can control/measure the pressure instead of the volume. Hint: use dH =TdS+Kfp instead of du-Tds-pd as a starting point of your solution. Show that the adiabatic equation Can be derived from the result you obtained in Problem 1 when you set AS 0
10. For the following linear programming problem, determine the optimal solution by the graphical solution method....
10. For the following linear programming problem, determine the optimal solution by the graphical solution method. Are any of the constraints redundant? If yes, then identify the constraint that is redundant. Max x + 2y s.t. x + y<= 3 x - 2y >=0 y<= 1 x, y >= 0 Please show all work in excel and step by step with formulas no solvers mode.
Solve Example 3.2 and 3.3 only, I have posted 3.1 as a reference Example 3.1 A...
 Solve Example 3.2 and 3.3 only, I have posted 3.1 as a
reference
Example 3.1 A robotic vehicle is exploring the surface of Mars. The stationary Mars lander is the origin of coordinates, and the surrounding surface lies in the xy-plane. The vehicle, which represents as a point, has the coordinates: x = 2.0 – 0.25t2 y = 1.0t + 0.025t3 a) Find the vehicle's coordinates and distance from the lander at t = 2.0s. b) Find the vehicle's displacement...
Solve Example 3.2 and 3.3 only, I have posted 3.1 as a
reference
Example 3.1 A robotic vehicle is exploring the surface of Mars. The stationary Mars lander is the origin of coordinates, and the surrounding surface lies in the xy-plane. The vehicle, which represents as a point, has the coordinates: x = 2.0 – 0.25t2 y = 1.0t + 0.025t3 a) Find the vehicle's coordinates and distance from the lander at t = 2.0s. b) Find the vehicle's displacement...
Prove that f and g are equivalent using both the graphical and algebraic approach. If they are not, provide a counter-example that shows how they are not equivalent.
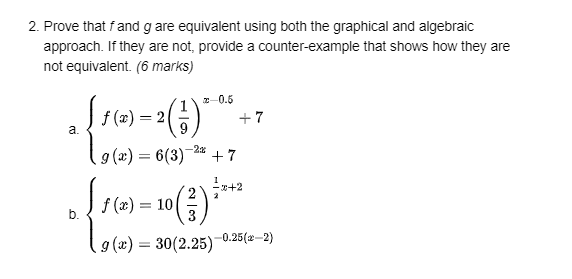 Prove that f and g are equivalent using both the graphical and algebraic approach. If they are not, provide a counter-example that shows how they are not equivalent. https://i.gyazo.com/df6c283c040522b4baab4e52d0b91104.png
NT 2-3. Calculate the hydroxyl ion molar concentration [OH-] for a solution with a pH of...
NT 2-3. Calculate the hydroxyl ion molar concentration [OH-] for a solution with a pH of 12. Show the formula before plugging in values. Show units
Solve the following linear program using the graphical solution procedure: (1) What are the value of...
Solve the following linear program using the graphical solution procedure: (1) What are the value of A and B at each extreme point and (2) an optimal solution? Max 5 A + 7 B s.t (1) A <= 6 (2) 2 A + 3 B >= 18 (3) A + B <= 8 (4) A and B are Non-Negative
solve each inequality and express the solution sets in interval and graphical notation solve each inequality...
 solve each inequality and express the solution sets in
interval and graphical notation
solve each inequality and express -the soluti nterslal andgraphical (26-5)-220 3-32 4 5.
solve each inequality and express the solution sets in
interval and graphical notation
solve each inequality and express -the soluti nterslal andgraphical (26-5)-220 3-32 4 5.
Please be clear graphic solution Question (4): Use the graphical solution to solve the following LP...
 Please be clear graphic solution
Question (4): Use the graphical solution to solve the following LP problems through the following steps: a- Specify the feasible solution space b- Specify the basic feasible solutions Count the number of basic feasible solutions d- Draw the Isoprofit line direction e- Determine the optimal solution (Zmax Xop, X20p) Max Z=2x1 + x2 Subjected to: 5 x2 60 2x1 XI X2 10 3x1 x2 44 Xi, X2 > 0
Please be clear graphic solution
Question (4): Use the graphical solution to solve the following LP problems through the following steps: a- Specify the feasible solution space b- Specify the basic feasible solutions Count the number of basic feasible solutions d- Draw the Isoprofit line direction e- Determine the optimal solution (Zmax Xop, X20p) Max Z=2x1 + x2 Subjected to: 5 x2 60 2x1 XI X2 10 3x1 x2 44 Xi, X2 > 0
 In Example 3.3 and the acceleration of the translating piston at the given instanu if a,-10p rad/sec and α.-55 rad/sec . see Figure ExAMPLE 3.11 of the translating piston at the given instanr 13in, h 62 Figure E3.11
 4. (40%) using the graphical method find the solution for the following problem. Verify this solution using the KKT requirements. Plot the gradients of the objective function and the active constraints at the optimal point MinfcX,y)- (x-3)2 (Y-3) s.t 9:X+2Y-6s 92: 2X+Y-6s0
4. (40%) using the graphical method find the solution for the following problem. Verify this solution using the KKT requirements. Plot the gradients of the objective function and the active constraints at the optimal point MinfcX,y)- (x-3)2 (Y-3)...
4. (40%) using the graphical method find the solution for the following problem. Verify this solution using the KKT requirements. Plot the gradients of the objective function and the active constraints at the optimal point MinfcX,y)- (x-3)2 (Y-3) s.t 9:X+2Y-6s 92: 2X+Y-6s0
4. (40%) using the graphical method find the solution for the following problem. Verify this solution using the KKT requirements. Plot the gradients of the objective function and the active constraints at the optimal point MinfcX,y)- (x-3)2 (Y-3)...
 Analyze Example 3.3. Find the entropy change for ideal gas if you can control/measure the pressure instead of the volume. Hint: use dH =TdS+Kfp instead of du-Tds-pd as a starting point of your solution. Show that the adiabatic equation Can be derived from the result you obtained in Problem 1 when you set AS 0
 Solve Example 3.2 and 3.3 only, I have posted 3.1 as a
reference
Example 3.1 A robotic vehicle is exploring the surface of Mars. The stationary Mars lander is the origin of coordinates, and the surrounding surface lies in the xy-plane. The vehicle, which represents as a point, has the coordinates: x = 2.0 – 0.25t2 y = 1.0t + 0.025t3 a) Find the vehicle's coordinates and distance from the lander at t = 2.0s. b) Find the vehicle's displacement...
Solve Example 3.2 and 3.3 only, I have posted 3.1 as a
reference
Example 3.1 A robotic vehicle is exploring the surface of Mars. The stationary Mars lander is the origin of coordinates, and the surrounding surface lies in the xy-plane. The vehicle, which represents as a point, has the coordinates: x = 2.0 – 0.25t2 y = 1.0t + 0.025t3 a) Find the vehicle's coordinates and distance from the lander at t = 2.0s. b) Find the vehicle's displacement...
 solve each inequality and express the solution sets in
interval and graphical notation
solve each inequality and express -the soluti nterslal andgraphical (26-5)-220 3-32 4 5.
solve each inequality and express the solution sets in
interval and graphical notation
solve each inequality and express -the soluti nterslal andgraphical (26-5)-220 3-32 4 5.
 Please be clear graphic solution
Question (4): Use the graphical solution to solve the following LP problems through the following steps: a- Specify the feasible solution space b- Specify the basic feasible solutions Count the number of basic feasible solutions d- Draw the Isoprofit line direction e- Determine the optimal solution (Zmax Xop, X20p) Max Z=2x1 + x2 Subjected to: 5 x2 60 2x1 XI X2 10 3x1 x2 44 Xi, X2 > 0
Please be clear graphic solution
Question (4): Use the graphical solution to solve the following LP problems through the following steps: a- Specify the feasible solution space b- Specify the basic feasible solutions Count the number of basic feasible solutions d- Draw the Isoprofit line direction e- Determine the optimal solution (Zmax Xop, X20p) Max Z=2x1 + x2 Subjected to: 5 x2 60 2x1 XI X2 10 3x1 x2 44 Xi, X2 > 0
Most questions answered within 3 hours.
-
Suppose that on a temperature scale X, water boils at 203.0°X
and freezes at -105.7°X. What...
asked 30 minutes ago -
BaS crystallizes in a cubic unit cell with S2- ions on each
corner and each face....
asked 1 hour ago -
A. 0≤P(Oi)≤10≤P(Oi)≤1 for each i
B. P(Oi)≤0P(Oi)≤0
C. P(Oi)=1+P(OCi)P(Oi)=1+P(OiC)
D. P(Oi)≥1P(Oi)≥1
If an experiment consists of...
asked 2 hours ago -
A battery has an emf of 9.20V and an internal resistance of 1.20
ohm. a)What resistance...
asked 2 hours ago -
The area of an elastic circular loop decreases at a constant
rate, dA/dt = −6.60×10⁻³ m2/s...
asked 3 hours ago -
The denaturation of proteins can be described by the
equilibrium
F⇌U
where F and U represent...
asked 5 hours ago -
Please answer what the maximum and minimum force is, and the
angle on the ion is...
asked 5 hours ago -
implement a program that reads a number of rows and a symbol.
The program will draw...
asked 5 hours ago -
Assume that when adults with smartphones are randomly selected,
45% use them in meetings or classes....
asked 5 hours ago -
Determine the number of formula units of
Na2SO4 and moles of oxygen contained in 8.11
moles...
asked 5 hours ago -
Explain in steps on the following code
What would be the output when executed
using System;...
asked 5 hours ago -
Given the information in the table, which of the following
statements is CORRECT?
Stock A
Stock...
asked 5 hours ago